Quantitative Content Analysis
1. Introduction and Background
Quantitative content analysis (see also QualContentAnalysis) utilizes a variety of tools and methods to study media content. The broad nature of the field has led to various definitions over the years. According to Berelson (1952) content analysis is "a research technique for the objective, systematic, and quantitative description of the manifest content of communication." Holsti (1968) says that content analysis is "any technique for making inferences by systematically and objectively identifying specified characteristics of messages." While Kerlinger (1986) defined content analysis as "a method of studying and analyzing communication in a systematic, objective, and quantitative manner for the purpose of measuring variables." More modern definitions have specifically included refernences to social media, sentiment analysis, and big data approaches. Overall, quantitative content analysis in this way transform observations of found categories into quantitative statistical data.
Content analysis grows out of work conducted by theorist Alfred Lindesmith, who devised a means of refuting a hypothesis known as The Constant Comparative Method of Qualitative Analysis," in 1931. Quantitative analysis built upon these qualitative research tools and applied more rigorous statistical and scientific techniques. Dr. Klaus Krippendorff created a series of six questions, based off Lindesmiths work, that must be considered in any content analysis:
- Which data are analyzed?
- How are they defined?
- What is the population from which they are drawn?
- What is the context relative to which data are analyzed?
- What are the boundaries of the analysis?
- What is the target of the inferences
While analysing this data, the assumption is that words and phrases mentioned most often are those reflecting important concerns in every communication. Therefore, quantitative content analysis starts with word frequencies, space measurements (column centimeters/inches in the case of newspapers), time counts (for radio and television time) and keyword frequencies. However, content analysis extends far beyond plain word counts, e.g. with "Keyword In Context" routines words can be analysed in their specific context to be disambiguated.
These forms of quantitative analysis have been used to study social media, corporate communications, website visits, elections, etc. With the exponential increase of both the amount of data available, and the capabilities of computers, quantitative research is being used in a growing number of fields.
2. Methodology
Quantitative analysis requires formal properties such as word frequencies, space measurements, time counts, hashtags, number of tagged people in an image, number of friends, or liked pages. The objects of analysis may vary from traditional textual content (messages, bibliometrics, citation analysis/indexing, webpages, trending topics on twitter), to any media object with specified formal properties or metadata (video, photographs, phone conversations). At least three important distinctions from qualitative content analysis arise as a result of this. First, as opposed to qualitative analysis, quantitative (or computer-based and automated) analysis is better suited for closed inquiries, and typically results in emergent categories rather than manually assigned categories (which also makes this type of analysis useful to derive probable predictions about the future). Second, as a result of focussing only on formal properties, quantitative content analysis typically applies to manifest contents (literal content) rather than its latent meaning (implied content). Third, McKeone (1995) distinguishes between prescriptive analysis (which has a closely defined set of specific parameters) and open analysis (which can be applied to many times of texts and content, and where dominant messages are identified in the analysis). Moreover, because the researcher often requires instruments to measure and count (e.g. a computer), the reliability (every research will get the same results) and validity (it measures what it is supposed to measure) of the apparatus and techniques (e.g. its software) should always be reflected upon as part of the research (see also Zeh 2005).
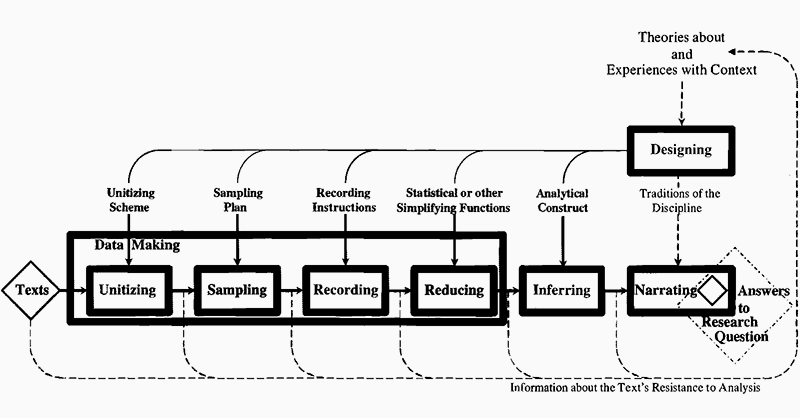
Components of Content Analysis (original diagram from Krippendorff 2004, 86; figure 4.2). In his seminal work Content Analysis: An Introduction to Its Methodology, Krippendorff (2004; ch. 4-9) presents an outline of the components of content analysis and identifies its core principles. Conducting quantitative content analysis involves designing the content analysis, defining units, sampling, recording and coding, and data language (86; figure 4.2).
- Designing. As a starting point, the researcher should design the analysis based on existing theoretical frameworks and experiences relevant to the research question. This essential phase has as its goal to plan each step in the process of producing a robust answer to the initial research question. This phase often involves developing hypotheses to which the results of the analysis can be tested or related. The design and research question will then guide the other six components of the actual content analysis.
- Unitising. As each step in the process has been mapped out by the researcher, the data needed for the analysis can be created (e.g. assembled, captured, or produced). Generally, "units are wholes that analysts distinguish and treat as independent elements" (97). Unitising frames the object of analysis so as to be able to process the discrete elements. While 'text' is not quantitative, its number of characters, lines of text, words or pages can be counted, measured, compared and visualised. To this purpose, a wide variety of ways of defining units exist. Furthermore, different types of units are used for sampling, recording and coding, and providing context. Krippendorff also notes that there are ways of defining units "so as to increase productivity, efficiency and reliability of content analysis" (97).
- Sampling. Sampling reduces the whole of available objects of analysis to a manageable corpus which is representative of the whole set. As such, it is about constructing the size of the sample as much as about finding appropriate sampling techniques. Different objects of analysis may require different sampling techniques that are applicable to that object (e.g. text-based such as Web pages or transcripts, or visual such as photographs or movies). As Krippendorf (2004) notes, statistical sampling theory offers so-called probability sampling techniques, which are designed to ensure that all sampling units have the same chance to be included in the sample (113). The techniques he identifies as applicable to texts are random sampling, systematic sampling, stratified sampling, varying probability sampling, cluster sampling, snowball sampling, relevance sampling, census, and convenience sampling. The last in this list is in contradiction with some key features of statistical sampling theory, namely because it is motivated by the available corpus even if it is known not to be incomplete (120-121). This is an issue often raised in relation to contemporary Big Data analyses.
- Coding/recording. Recording and coding are procedures that aim to capture the object of study in such a way so as to make it possible to re-search it for patterns. The research must be recorded in a way that makes it durable and able to withstand recurrent examinations. Recording or coding thus encode the research in a particular way, so that other researchers can reliably execute the same process and get to the same results. Krippendorff (2004) recommends four types of recording instructions that are needed: the qualifications that coders need to have; the training that coders must undergo in preparation for the task of recording; the syntax and semantics of the data language, preferably including the cognitive procedures that coders must apply in order to record texts and images efficiently and reliably; and finally, the nature and administration of the records to be produced (127). Furthermore, it is important to provide interpretability of the research findings by assuring access to their meanings. Data languages also play an important role in this component of the analysis. Data languages are descriptive devices, and as Krippendorff notes: "For content analysts, who start with textual matter, images, verbal exchanges, transmissions, and records of observed phenomena, a data language describes how all the categories, variables, notations, formal transcripts, and computer-readable accounts hang together to form one system" (150). As descriptive devices, they deal differently with different types of variables such as binary variables, categorical variables, ordinal metrics, interval metrics, ratio metrics (Krippendorf 2004; Zeh 2005)
- Reducing. To gain cognitive access to the meaning of large quantitative content analyses, reductive techniques are often required. These are usually computational or automatic techniques for "summarising the body of recorded text and the justifications for these techniques relative to what is known about the context of the texts" (Krippendorf 2004, 360). For instance, statistical visualisations are commonly relied on as simplifying function for creating such a summary (e.g. to show the correlation between two variables). Typically, statistics are represented as relational tables. These tables can then be visualised in many different ways enabling different perspectives on the same data set (in this sense it is reductive).
- Inferring. Relying on analytical constructs or models of the chosen context to abductively infer contextual phenomena. That is, drawing conclusions about particular phenomena with only a statistical or probable certainty. For instance, by extrapolating the trajectory of a specific variable over a given time, one may be able to conclude (with statistical certainty) the future development of that variable. Other inferences might require relating the findings of the analysis to other data sets. You might for instance do a comparitive analysis between different sets of content (Marra, Moore, and Klimczak 2004). In such a case, the content analysis becomes part of a larger research effort.
- Narrating. As a final component to the process of quantitative content analysis, narration involves answering the initial research question that guided the research. Narration relies on "the narrative traditions or discursive conventions established within the discipline of the content analyst" (Krippendorf 2004, 83) and does so in order to make the results both comprehensible and accessible to others. This may entail arguing for practical significance, reflecting on appropriateness of the methods used, arguing for the significance of the findings, or making recommendations for further research. Contemporary quantitative content analyses sometimes omit this final component, if they are published directly in a visual format such as an information graphic.
3. Scenarios and Problems
Berelson (1952) suggested five main purposes for quantitative content analysis: to describe substance characteristics of message content; to describe form characteristics of message content; to make inferences to producers of content; to make inferences to audiences of content; and finally, to predict the effects of content on audiences (Berelson 1952; Macnamara 2005, 3).Holsti (1969) has grouped fifteen different uses as suggested by Berelson (1952) into three categories: first, making inferences about the antecedents of communications; second, describing and making inferences about the characteristics of communications; and third, make inferences about the consequences of communications. "Scenarios as used in business, other organizations, and government planning fall into two broad categories. One is scenarios that tell about some future state or condition in which the institution is embedded.
That scenario then is used to stimulate users to develop and clarify practical choices, policies, and alternative actions that may be taken to deal with the consequences of the scenario.
The second form tells a different story. It assumes that policy has been established. Policy and its consequences are integrated into a story about some future state." (Coates 2000; Scenario Planning))

3.1 Personal Scenario
Quantified Self Approaches to Support Reflective Learning - Scenario of developing better strategies using self-monitoring Tracked Aspects: All emotional, private and physiological data goes into account to have a greater insight in general activity specialized in tracking behavior:The data can be enriched with other context data such as the social context (information abiout the social context of a user), or spacial context (the location in terms of city, street and room).
There is often software available to do self reporting through sensors that directly track user behavior and experience.
All aspects give you a deep insight on the self-knowledge through numbers.
 The figure shows a three dimensional feedback system based on the reflective process. Recalling and revisiting experiences enrich the process of returning to and evaluating experiences.
(A) Tracking: keeping track of certain data
(B) Triggering: reflective processes based on the data
(C) Recalling and Revisiting: enrichment from past experiences (Rivera-Pelayo, Zacharias, Müller, Braun 2012; Applying Quantified Self Approaches to Support Reflective Learning)
3.2 Health Scenario
Abstract: In our society, terms like die, dying and death remain taboo.Society refers to passing away, going to a better place, etc. Recognizing the problem of the failure to use explicit terms might hinder the effectiveness of communication between doctors and patients.
--exploring possible explanation--
Researcher Z wants to know how often health care providers, patients, or family members use explicit terms versus euphemisms.
Under what circumstances are these explicit terms used?
How are the terms die, dying, and death used in clinician-patient communication when discussing hospice care, and what alternative terms are used?
Researcher Z: sampling plan to maximize the diversity of the sample around demographic characteristics.
Two types of communication events with patients who had received a terminal diagnosis were sampled:
(A) One was discharge teaching for hospitalized patients who were being transferred to home hospice.
(B) The other communication event was clinician-patient/family conferences in out- or inpatient settings.

Data analysis started with computer-assisted searches for occurrences of the terms die, death, and dying in the transcripts. Word frequency counts for each of the three death-related terms in a transcript were calculated and compared to the total length of the communication event.
Identifies: alternative terms or expressions instead of death, die, or dying.
Frequencies of euphemisms versus direct terms were compared for type of speaker, demographic characteristics of clinician, and demographic characteristics of patient within each communication event and across the total sample. (Hsieh, Shannon 2005; Qualitative Health Research)
3.3 Business Scenario
Connected to Strategic Marketing / Strategic Plan based on Strategic Assumptions Shell Example: Shell OilIn the early 1970s, Shell Oil used scenario policy planning to evaluate long-term decisions.World oil prices were low and were expected to remain so. Shell scenario planners considered a rise in prices to be possible, contrary to both market expectations and those of Shell executives.
 This model shows a two-dimensional ranking space which indicates "level of impact" and the "level of uncertainty" (High/Low)
(B) Predictability: the reduction of the number of relevant driving forces into smaller bits/ possibilities to adequately cope
(C) Plausible Scenarios: each scenario depicts another future state/ stories by looking for causal structures (Postma, Liebl 2003; How to improve scenario analysis as a strategic management tool?)
3.4 Problems
Most critiques on Quantitative Content Analysis (QCA) focus on problems with the validity and reliability of the method. Krippendorff states that 'in the persuit of high reliability, validity tends to get lost' (2004-1). He explains for example that analyzing content using specific keyword counts leads to a very reliable, consistent result. There is no denying that the keywords have been used a certain amount of times and any purely quantitative statement that could be drawn from those calculations is easily traceable. The problem arises when meaning is inferred from the quantitative findings. Themes can be underrepresented in a specific keyword selection and sentiments attached to keywords can be overlooked. This compromises the validity of the method. An issue that is related to validity and reliability is discussed by Rourke et al. (2004). As is discussed above, QCA can involve the making of categories and specifications. The reason behind such distinctions is susceptible to subjectivity. It is important that the argumentation involved in making the distinctions is clear in the analysis. When researching image content through quantitative content analysis a different problem arises. To be able to quantify images one actually has to look at the metadata instead of the images themselves to create meaning. Where was a picture taken, who was it taken by, what tags are attached to it and who liked the picture? Even when looking at the image, it will have to be reduced to a set of calculable variables, such as hue, saturation, grain, etc. It is useful to think about what the actual object of study is and if it is possible to come close enough to it through qualitative content analysis. In QCA, especially when using large amounts of data, the researcher becomes more and more reliable on programs that handle the data. A problem that occurs here is the lack of understanding of such programs. As can be read in the Tools section, there are quite a few different programs that can be used. It usually takes some investing to understand how to get the program to process the data you give it in the desired fashion. Even then the program remains a 'black box' whose inner workings are to a certain degree unknowable to the user. This is problematic for the systematicity and reproducability of the research. Lastly, when performing research with data that is gathered from users of for instance social networks the issue of privacy occurs. A lot of users are not fully aware of what they've signed up for when creating an account on Facebook, Twitter, or Instagram. They might not be aware that the content they produce is to an extent up for grabs for researchers. These are all issues that a researcher has to be aware of when choosing methods and evaluating or interpreting results. It's useful to combine a QCA with other techniques so as to cover the critiques that would arise when solely using this method.4. Case Examples
In 1972, the kingdom of Bhutan developed the GNH - Gross National Happiness. It was elaborated by the king Jigme Singya, it had the support of United Nations and it calculates a develop of a country, not based on economic growth, but environment preservation and quality of living. It was presented to be an alternative to GDP - Gross Domestic Product.
To measure the country national progress, a quantitative analysis was the starting point for the research. 9 metrics were used to define the first Global GNH Survey. All the points were indicated via direct survey and statistical measurement. In each point, different categories were applied.- Psychological well-being
- Standard of living and happiness
- Good governance and gross national happiness
- Health
- Education
- Community vitality
- Cultural Diversity and resilience
- Time use and happiness
- Ecological diversity and resilience

Screening question measures from 1 to 4. Whereas, 1 - for most negative, 2 - uncertain, 3 - neutral and 4 - positive.
The GNH provides indicators to sectors, serving as guidance for development. The data collection by screening tool, its a simple way to ask questions and collect objective answers.5. Relevant Tools & software
In quantitative research, it is common to use graphs, tables, charts and other non-textual elements to help the reader understand the data. There are many different tools and software packages that are used to organize raw data and that help to show correlations between variables in your data. As outlined in the how to section: statistics are typically represented as relational tables. These tables can then be visualized in many different forms (graphs and charts) enabling different perspectives on the same data set. In this section different statistical software packages that allow for such new perspectives on the data are shown. The following software allow for statistical methods of organizing and examining quantitative data. The software discussed below are commonly used for managing raw quantitative data, to analyze survey results, historical data and content analysis. They can also be used for forecasting or determining the probability of a particular event.| Name | Interface | Platform | Pros | Cons | Price (for students) |
| STATA | GUI & command syntax* | Windows, Mac, and Unix | Compatible with most data sources and online databases | Relatively hard to learn | $189 (perpetual) or $98 one year |
| IBM SPSS | Mainly GUI, supports a command syntax | Windows, Mac, and Unix | Most commonly used statistical software | Not as flexible as R and SAS for customized analyses | Around $100 for one year |
| SAS | Mainly command syntax, basic GUI as optional add on. | Windows and Linux | Intermediate-level users can perform complex data analyses tailored to their needs. | It is not possible to buy a student license for home usage. | Licensing only though universities |
| Tableau | GUI | Desktop version is Windows only. Online version: Windows, Mac, and Unix | Visually appealing, easy to use drag and drop interface | Not adaptable to specific research needs | Free for one year |
| R | Command syntax | Windows, Mac, and Unix | Free to use GNU software | Hard to learn, only command syntax interface | Free, open source GNU |
Command syntax: Interface based on textual commands and statements written in programming language.
5.1 STATA
Stata is a widely used statistical software package for managing, analyzing, and graphing data. It runs on a variety off platforms including Windows, Mac, and Unix. Sata can be used with both a graphical user interface (through the use of menus and associated dialogs) and though the command line syntax for more powerful and complex operations. With Sata you can generate graphs that can be exported to EPS or TIF for publication, to PNG for the web, or to PDF for viewing. With the use of a script it is also possible to automatically produce graphs in a reproducible manner. Students can buy Stata for $189 (perpetual) or $98 for one year. Webite: http://www.stata.com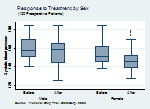
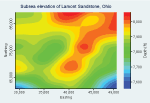
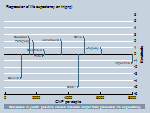
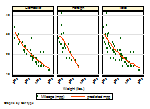 Screenshots of Stata. source: http://www.stata.com/why-use-stata/
5.2 IBM SPSS
SPSS is one of the most popular quantitative analysis software especially amongst social science researchers. Using SPSS you can perform many data management and statistical analysis tasks. SPSS can take data from almost any type of file and use them to generate tabulated reports, charts, plots of distributions and descriptive statistics. Or to conduct complex statistical analyses. SPSS is relative easy to use and allows for additional modules. Therefore, its use is widely adopted by market researchers, health researchers, survey companies and academic researchers. SPSS provides an user interface that makes statistical analysis more intuitive for all levels of users. Simple menus and dialog box selections make it possible to perform complex analyses without using a command syntax. The latter can be used for more specialized statistical procedures. IBM SPSS is available for the platforms; Windows, Macintosh, and the UNIX systems. Demo of IBM SPSS. source: http://www.youtube.com/watch?v=TSz4P6VpaUs_ Students can buy a IBM SPSS licenses for around $100 a year. IBM also offers a 14 day free trial. Website: www.ibm.com5.3 SAS
SAS Analytics provides an integrated environment for quantitative analysis, this means that the software is based around different modules that can be added according to your own preferences. The software allows for predictive analytics, data mining, text mining, forecasting and many different graph visualizations. Sas helps you organize raw quantitative data and offers a wide range of techniques and processes for the collection, classification, and analysis of data. The software mainly uses a command syntax with built in programs for commonly used tasks. An additional module (SAS/ASSIST) can be installed for a task-oriented visual interface. Because SAS works with a intuitive command syntax intermediate-level users can perform complex data analyses and data/file manipulations relatively easy. SAS is available for Windows and Linux, but they only offer licenses to students though universities who bought SAS already.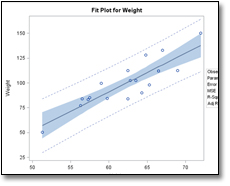
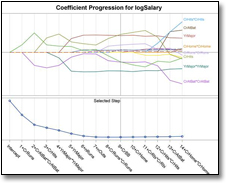
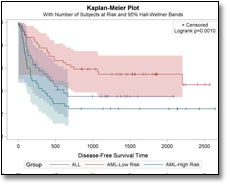 Screenshots of SAS. source: http://www.sas.com/technologies/analytics/statistics/stat/index.html
Website: www.sas.com
5.4 Tableau
Tableau is visually the most appealing statistical analysis tool. Tableau Desktop lets you interact with the data though an easy to use drag and drop system. You can connect to data in a few clicks, then visualize it by selecting and adjusting one of the preset interactive dashboards. The full version of Tableau Desktop allows you to work directly from a database. You can manage your own data connections and metadata, without altering the original database. This makes the software easy to use, but therefore it hard or even impossible to customize analyses exactly as you want them to be. Tableau Desktop is only available for Windows, Tableau offers an online environment with all the basic elements of Tableau Desktop that works with all modern internet browsers (thus on Windows, Mac, and Unix systems as well.) Demo of Tableau Desktop. source: http://www.tableausoftware.com/products/desktop Tableau offers full time students an one year license for free. Website: http://www.tableausoftware.com5.5 R
R analyses is an open source GNU project for statistical computing and graphics. It facilities for data manipulation, calculation and graphical display with the use of an easy to learn command syntax. The fact that R uses its own open source command syntax makes it adaptable for all kind of quantitative analysis. However, the lack of an graphic user interface makes R hard to use for the novice user.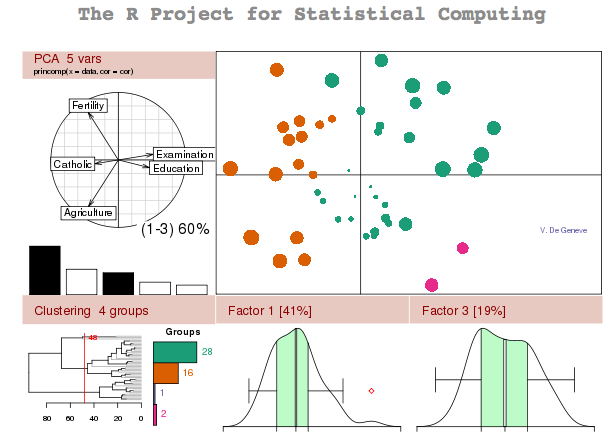 Screenshot of R. source: http://www.r-project.org
R is availible on a wide variety of UNIX platforms, Windows and Mac, and is free to use.
Website: http://www.r-project.org
6. References and Further Reading
Barringer, Bruce R, Foard F Jones, and Donald O Neubaum. A Quantitative Content Analysis of the Characteristics of Rapid-Growth Firms and Their Founders. Journal of Business Venturing 20.5 (2005): 663687. Print. Berelson, Bernhard. Content Analysis in Communication Research. New York: Free Press, 1952. Print. Content Analysis. Wikipedia, the free encyclopedia. 13 Sep. 2013. Web. 19 Sep. 2013. < http://en.wikipedia.org/wiki/Content_analysis >. Enzmann, Dieter R, Norman J Beauchamp, and Alexander Norbash. Scenario Planning. Journal of the American College of Radiology (JACR) 8.3 (2011): 175179. Print. Franzosi, Roberto. Content Analysis: Objective, Systematic, and Quantitative Description of Content. SAGE Benchmarks in Social Research Methods: Content Analysis. Ed. Roberto Franzosi. Vol. 1. London: SAGE Publications Ltd., 2007. ixlix. Print. Holsti, Ole R. Content Analysis. Content Analysis for the Social Sciences and Humanities. Boston: Addison-Wesley, 1969. 597692. Print. Hsieh, Hsiu-Fang, and Sarah E Shannon. Three Approaches to Qualitative Content Analysis. Qualitative Health Research 15.9 (2005): 12771288. Print. Jick, Todd D. Mixing Qualitative and Quantitative Methods. Triangulation in Action. Administrative Science Quarterly 24.4 (2013): 602611. Print. Krippendorff, Klaus H. Content Analysis: an Introduction to Its Methodology. 2nd ed. Thousand Oaks: SAGE Publications Inc., 2004. Print. ______. Reliability in Content Analysis: Some Common Misconceptions and Recommendations. Human Communication Research 30.3 (2004): 411433. Print. Macnamara, Jim. Media Content Analysis: Its Uses; Benefits and Best Practice Methodology. Asia Pacific Public Relations Journal 6.1 (2005): 134. Print. Marra, Rose M, Joi L Moore, and Aimee K Klimczak. Content Analysis of Online Discussion Forums: A Comparative Analysis of Protocols. Educational Technology Research and Development (ETR&D) 52.2 (2004): 2340. Print. McKeone, Dermot. Measuring Your Media Profile: A General Introduction to Media Analysis and PR Evaluation for the Communications Industry. Aldershot: Gower Publishing Ltd., 1995. Print. Postma, Theo J B M, and Franz Liebl. How to Improve Scenario Analysis as a Strategic Management Tool? Technological Forecasting and Social Change 72.2 (2005): 161173. Print. Prasad, B Devi. Content Analysis: a Method in Social Science Research. Research Methods for Social Work. Ed. D K Lal Das & Vanila Bhaskaran. New Delhi: Rawat Publications, 2008. 173193. Print. Riffe, Daniel, and Frederick Fico. Analyzing Media Messages: Using Quantitative Content Analysis in Research. Ed. Stephen Lacy. Mahwah: Lawrence Erlbaum, 2005. Print. Rivera-Pelayo, Verónica et al. Applying Quantified Self Approaches to Support Reflective Learning. Proceedings of the 2nd International Conference on Learning Analytics and Knowledge (LAK 12) (2012): 111114. Print. Rourke, Liam et al. Methodological Issues in the Content Analysis of Computer Conference Transcripts. International Journal of Artificial Intelligence in Education (IJAIED) 12 (2001): 822. Print. Rourke, Liam, and Terry Anderson. Validity in Quantitative Content Analysis. Educational Technology Research and Development (ETR&D) 52.1 (2004): 518. Print. Stemler, Steve. An Overview of Content Analysis. Practical Assessment, Research & Evaluation 7.17 (2001): n. pag. Print. Thayer, Alexander et al. Content Analysis as a Best Practice in Technical Communication Research. Journal of Technical Writing and Communication 37.3 (2007): 267279. Print. Weber, Robert Philip. Basic Content Analysis. 2nd ed. London: SAGE Publications, Inc., 1990. Print. Zeh, Reimar. A Practical Introduction Into Quantitative Content Analysis. Lehrstuhl für Kommunikationswissenschaft, Friedrich-Alexander Universität Erlangen-Nürnberg, 2005. Presentation.| I | Attachment | Action | Size | Date | Who | Comment |
|---|---|---|---|---|---|---|
| |
Krippendorff_2004_Components-of-Content-Analysis.png | manage | 27 K | 22 Sep 2013 - 20:56 | FernandoVanDerVlist | |
| |
Krippendorff_2004_Components-of-Content-Analysis_800px.png | manage | 69 K | 22 Sep 2013 - 21:36 | FernandoVanDerVlist | |
| |
bhutan.jpg | manage | 94 K | 22 Sep 2013 - 19:28 | GustavoLopez |
- Searching & Collecting
- Journal Guide
- Web & Blog Guide
- Research Communities
- Amsterdam Scene
- Amsterdam New Media Industry
- New Media Events
- New Media Methods
- Visualising Theories
- Key Works
- Academic Writing Guide
- Data Tools
- Data Visualisation
- Web Stats
- Research Apps
- Secondary Social Media
- Privacy
- Collaboration
 Copyright © by the contributing authors. All material on this collaboration platform is the property of the contributing authors.
 Ideas, requests, problems regarding Foswiki? Send feedback


