Network Analysis
Background and History
IntroductionNetwork analysis is a research approach that is suited to describing, exploring, and understanding various types of structural and relational aspects. Important contributions were made from an extremely wide variety of fields, including sociology, psychology, political science, anthropology, communication, business, mathematics, statistics, computer science, and physics.
Typically, a network consists of actors that represent individuals, organizations, programs, or other entities. Further, a network can be four different things: a conceptual model, a description of an existing real-world structure or system, a mathematical model, or a simulation. In its background and broad sense, network analysis is a field that mostly concerns itself with relational data and research questions. More specifically, the network paradigm has four important features[1]:
- Network analysis is a structural approach that focuses in part on patterns of linkages between actors;
- it is grounded in empirical data;
- it makes frequent use of mathematical and computational models; and
- it is highly graphical.
A history of network analysis approaches can be traced back to the Eighteenth century. In that century, European mathematician Leonhard Euler used a visual representation of a network of bridges and rivers to solve the now famous Königsberg bridge problem.[2] The problem asked if it was possible to walk around the town of Königsberg, crossing each of its seven bridges only once, and returning to the point of origin. By portraying the bridges and land as points with lines between them, Euler determined that no such path existed owing to the number of nodes and links. In doing so, Euler invented graph theory, which provides one of the mathematical foundations for network analysis. Later, throughout the 1800s and early 1900s social scientists posed questions about social relations and developed theories and terminology to describe social connections and social structure.[3]
In 1929 a new idea about ties between people was proposed in a short story by Hungarian writer Frigyes Karinthy. In the story, a character asserted that he could link anyone in the world to himself through at most five acquaintances, proposing what may be the first mention of the concept of six degrees of separation.[4] In the 1920s educational psychologists published a number of studies reporting on characteristics of social ties such as influence, interaction, and companionship.[5]
Major contributions to the method were made in 1934 by psychiatrist Jacob L. Moreno.[6] Moreno developed a new way of representing relationships on paper, called a sociogram. A sociogram was a drawing with points representing people connected by lines representing interpersonal relationships. Morenos work established network analysis as a unique discipline, and his sociograms were the first specific network analytic tool.[7]
In 1959, mathematicians Paul Erdõs and Alfréd Rényi, found out with their model that the larger the size of the network, the fewer connections between network nodes were needed to have the network be completely linked.
In the early 1970s sociologist Mark Granovetter posited that, in addition to strong ties to families and neighbors, each person has certain weak ties to casual acquaintances and that these weak ties hold a network together. Herein, the acquaintances and friends of friends could reach outside what might otherwise be closed and therefore allowed a larger network to form.[8]
Granovetters work was important for several reasons; it helped the development of a sophisticated and realistic model of network structure. Furthermore, Granovetters work was among the first applications of network theory, which attempted to explain social structure and human behavior. Granovetters findings led to a deeper understanding of how knowledge and information can be efficiently passed through large social networks.
Different approaches to network analysis
As mentioned earlier network theory is a field that is used to explain the different types of networks among individuals, businesses, organizations and even countries, how they arise and what characterizes them. Social network theory is used to explain individuals social networks, often within organizations or enterprises and in learning contexts and to identify characteristics of the actors interacting with each other. [9] In this section, I will discuss different approaches to social network analysis. My main focus will be network analysis in terms of communication, more specifically Social Media. The reason for this is that there are so incredibly many approaches to network analysis and I don´t have time or space enough to write about them all in this assignment. So this is a way to refine the assignment. Actors, relations and different media In social network theory the individuals are called agents and the interaction between the agents is called relationships. Actors and relationships constitute two major components in network theory. The relationships tell us who communicates with whom, about what, how often and the media that may be used for communication. [9]In today´s digitized social network-analysis is a good way of understanding how we interact with one another on social media. You can for example apply social network analysis on Facebook to reveal the relationship between agents in this specific medium or in one specific Facebook-group by analyzing who communicates with whom, what they talk about, how often they communicate and where they communicate (through chat, on the wall of the group etc). For this type of analysis you can for example use the Barnes fish net model. J. A. Barnes uses a the fishnet to show the complexity of a social network, in this example Facebook. The network in the fish net visualizes how people are related to each other through contact and interaction. Or as Fyrand (2005) says it: "The knots in the yarn represents actors and threads between nodes visualize the relationships between actors ". Barnes observed that we people connect to other people who have virtually the same status as ourselves. As a daily Facebook user I agree to Barnes statement. After a quick overlook of my friendship list I find a predominance of people I have studied with earlier who now work in the media business and people I study
with now in Amsterdam yeah, people who have the same status as me. Different tools for social network analysis
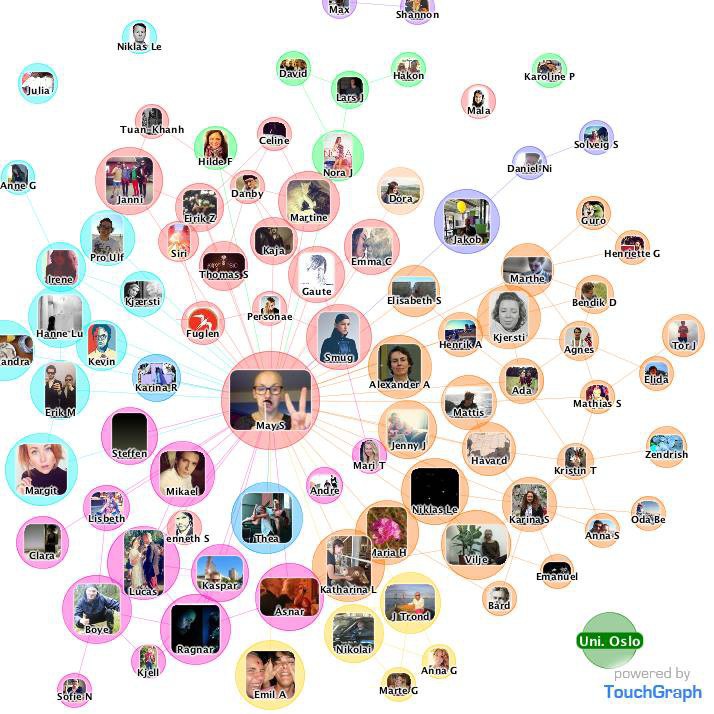
Since we live in a digitized world there is of course many apps you can use to do a social network analysis. And the great thing is that they do most of the job for you. However you have to do the job yourself If you use Barnes fish net or regular Actornetwork theory (ANT), a theoretical approach to social science that attempts to describe how actors in a society behave and interact.1 ANT is a heterogeneous network in which humans and non-humans are included as participants, where the relationship between the actors and their characteristics are essential, not their acquired or inherited characteristics. [10] But anyways, as mentioned there are easier ways to find out about actors and their relations. If you want to do a social network analysis on Facebook for example, you can choose between Social Graph, TouchGraph Photos, NameGenWeb, Friend Wheel and of course Gephi. If you are more interested in the social medium Twitter you can use Mention Map. All these tools are different approaches to analyzing different relations on social media. I will now write short about each tool. Social Graph The social graph essentially refers to "the global mapping of everybody and how they're related. Mark Zuckerberg is a huge fan of this app. He wants to connect Facebook with parts of the Web that other social sites are building and he describes this as the Open Graph. These connections aren't just happening on Facebook, they're happening all over the Web, and today with the Open Graph we're bringing all these things together, Zuckerberg claims. TouchGraph Photos
This app allows you to collect images of all the friends you have on Facebook. Then the app structures them and gives them different color codes based on how close or not close friends they are and what mini-trative network they belong in. I tried it out. Here is the result:
 NameGenWeb
 shows social relations between people (actors) on different social media. I applied it on Facebook and got this result. The different colors shows the connections between people and the different networks they belong to.
NameGenWeb
NameGenWeb shows social relations between people (actors) on different social media. I applied it on Facebook and got this result. The different colors shows the connections between people and the different networks they belong to.
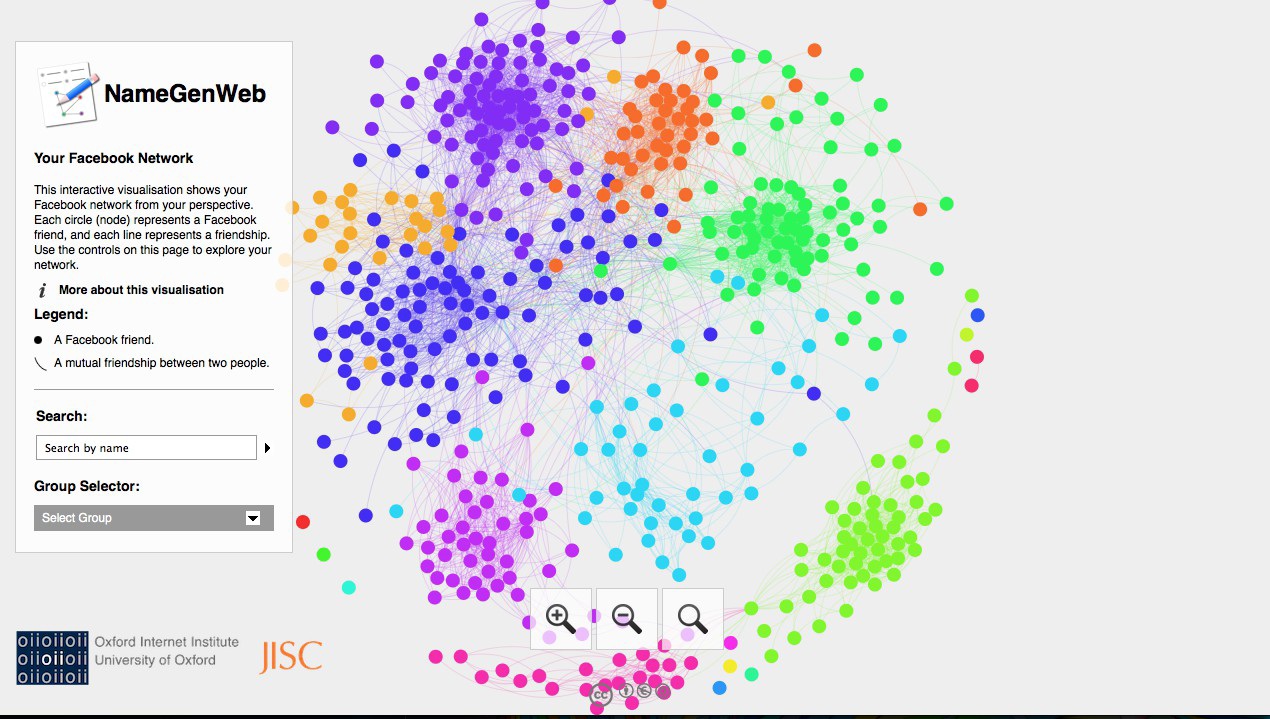
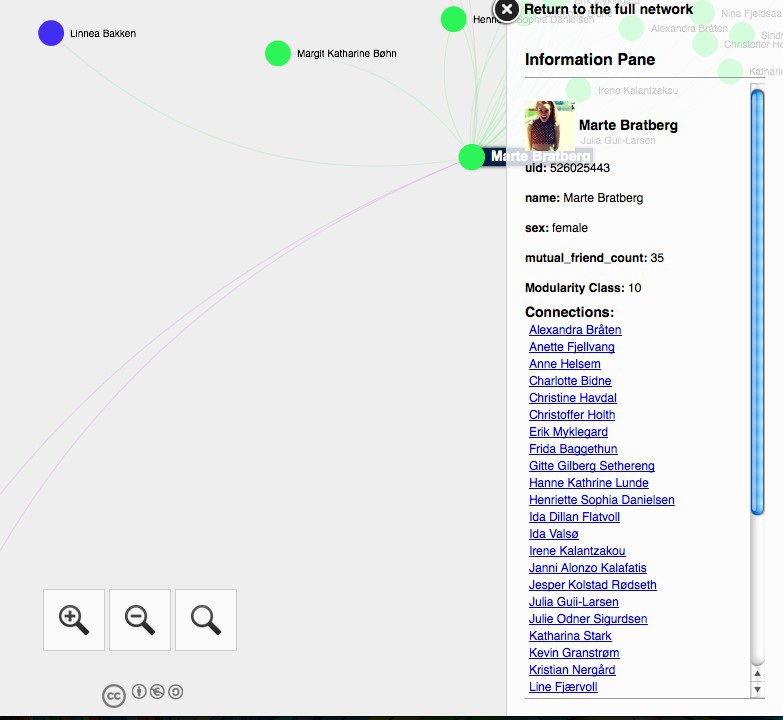 You can search up a name and see which people this person knows and how he or she is related to me and other friends and how many mutual friends we have. And you can also select a color and see which people who are connected in this specific Facebook-network.
Friend Wheel
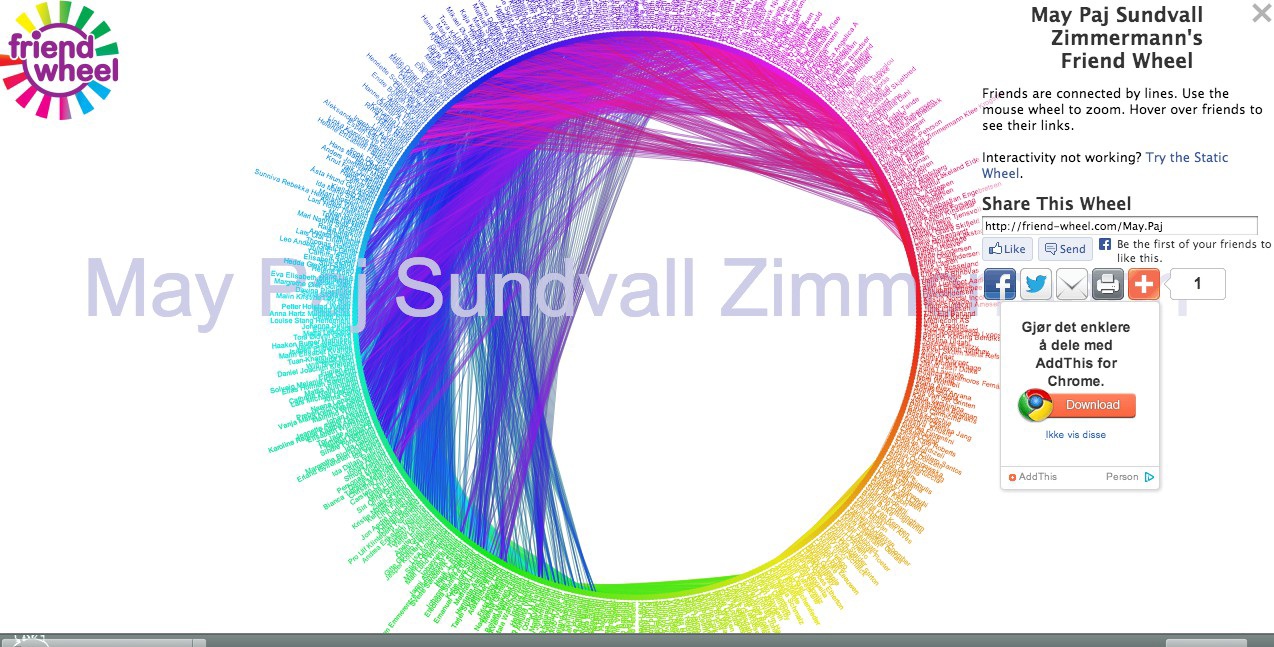
Friend Wheel shows all your friends on Facebook and what the link between them is. Friends are connected by lines and you use the mouse wheel to zoom. Hove over friends to see their links.
 Gephi
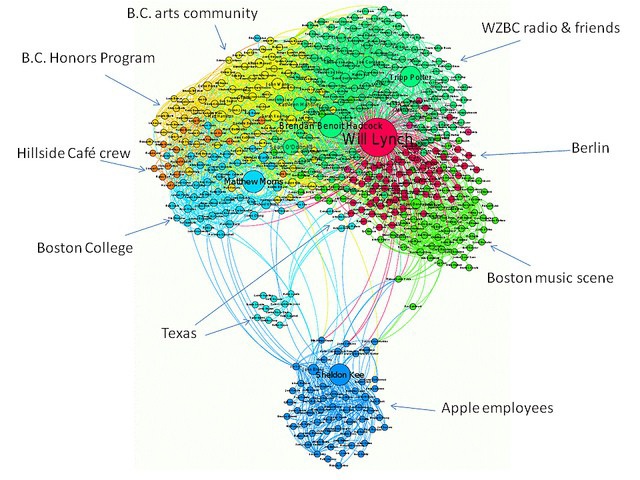
To produce a network, two inputs are needed: a list of the actors composing the network, and a list of the relations (the interactions between actors). As part of a mathematical object, actors will then be called nodes, or vertices, and relations will be denoted as edges. To use Gephi to do a network analysis of your Facebook data you have to download myfnetwork from Facebook. [11] Then you get the data you need. After that you import it in Gephi. Unfortunately the myfnetwork app was down so I was not able to test it myself, but I found an image that illustrates the different graph you can get out of different social network analysis with Gephi.
 Mention Map
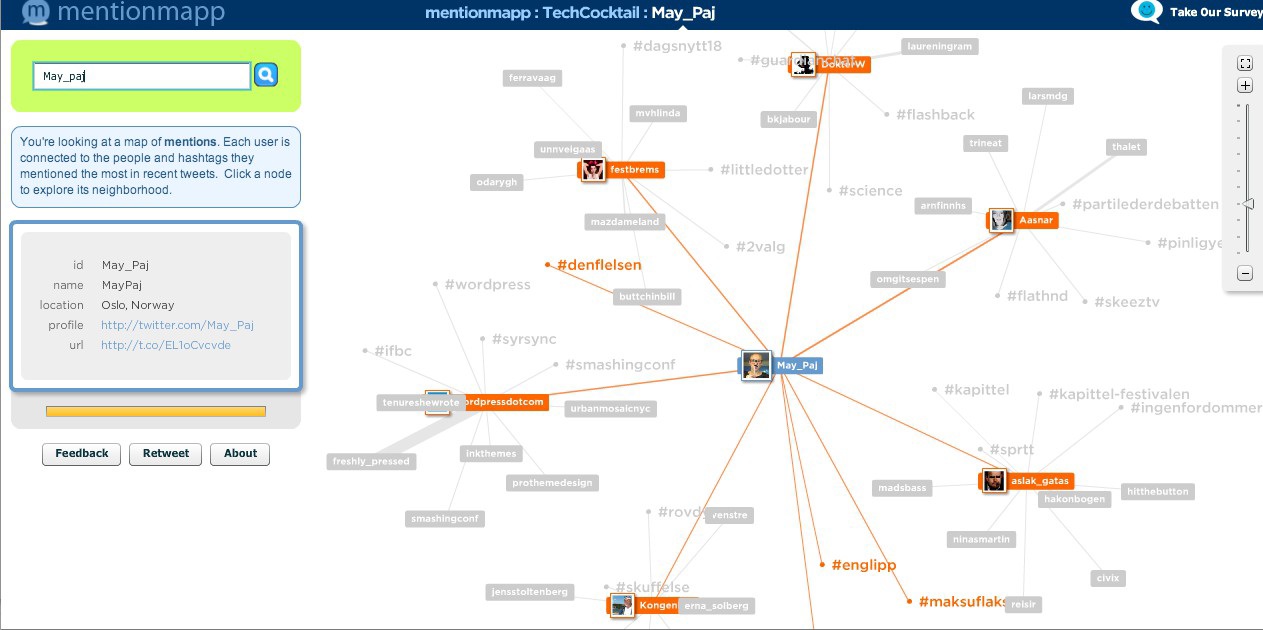
When you use Mentionmap you're looking at a map of mentions on a medium, in my case on Twitter. Each user is connected to other people by #hashtags they have mentioned in their most in recent tweets. You can click on the different nodes ( thats another word for actors) to explore its neighborhood. I checked my Twitter-profile out. And got this:
Digital network analysis
Precursor of network analysis is graph theory, a mathematical approach to construct networks in the form of graphs. With this method one can calculate certain distances between several spots (nodes), for instance in an infrastructure. Also the importance of the points and incoming and outgoing lines (edges) between them is weighted and enables calculated conclusions about the networks infrastructure. Graph theory is a branch of mathematics, concerned with the form of structures, the topology.[13] Graph theory offers measures to represent the principal features of social networks, but it cannot be fully applied by sociologists. This forms the start for a different way of analysis, in the light of sociological studies. In the last forty years, network analysis has developed itself as a fruitful approach to the analysis of social structures.[14] [16] [17] Although it seems to be a recent innovation, used as a specialised technical method by sociologists, it is as old as sociology itself and it has been used in various other disciplines for many years. In the 1930s Moreno developed sociometry to structuralize the relations among small groups of friends.[15] The popular persons within this web were called hubs; lines with friendship choices surrounded these. Later on in the 1950s Bavelas and Festinger focused more on studying the group dynamics in the light of American social psychology.[14] John Barnes was the first to coin the term of social network (Barnes 1954). The object of study moved from individuals or groups to African tribal societies and urban communities in Britain in the field of anthropological studies. The studies on British families expanded in researching the communal patterns of neighbouring and working by Banton (1966). In general, social psychologists tend to look more at the centrality of different actors in the patterns of the network, while sociologists and anthropologists were more inclined to the density or connectedness within a large network.[14] In the late 1970s the Digital Revolution took place, which implies a change from analogue mechanical and electronic technology to digital technology. From the 1980s on digital computers have been increasingly crucial not only to institutions, but also to individuals. Computer sciences have been a research field since the 1960s and developments in the field of non-trivial networks have been made during the Cold War era. These communication driven networks have been fundamental to the entrance of the Internet, which is a physical network of computers, linked together by optical fibre and data connections. After that, the World Wide Web in 1990, a network of Web pages containing information, linked together by hyperlinks from one page to another without natural or chronological order.[18] These scale-free network structures gave breath to the online social media networks from the beginning of the 21st century. Altogether, this changed the way of analysing networks in two ways. First, the size and the character of the networks itself changed, which made the study of object different than before. Second, the way of analysing the networks changed, because of the introduction of software programmes that could help gather Big Data-input and create a more advanced visualisation as output. The Small World Phenomenon, also known as the six degrees of separation, which accrues from the analogue social network analysis and is tested by Stanley Milgram in 1967, can be easily tested digitally through an online social network, like Facebook. The potential to create complex networks and refined visualisations opened a new world of possibilities for both qualitative and quantitative research of network analysis in the field of social sciences, information sciences and economics. Improvements in organisational, environmental, health and social optics have been enabled by the digital network analysis."The information revolution has given birth to new economies structured around flows of data, information, and knowledge. In parallel, social networks have grown stronger as forms of organization of human activity." [19]
Advantages and problems
Advantages:
One of the obvious advantages in doing network analysis is that very complex and incomprehensible amounts of connections can be made clear and structured. This way conclusions can be drawn about a large quantity of connections that otherwise would seem irrelevant or too complicated. In the political case example, the use of certain words can be linked to the voting behavior of respectively democrat or republican voters. Without the use of network analysis this specific kind of research into voting behavior would be almost impossible.
Another advantage of network analysis can be seen in the work of Florence Nightingale: by analyzing all the different causes of mortality and connecting them in a comprehensive network, the military could take adequate measures to prevent a significant number of deaths. This example shows that by using network analysis, you can literally save lives.
In the digital age the advantages of network analysis are being used more and more. If it is by connection with all your real life affiliates online in networks as Facebook, Twitter or Google+, or by using your network to find a job or search for the right employee on LinkedIn; the ways in which you can expand and use your network by analyzing the different connections are huge. Because of all the criteria that can be analyzed the possibilities for doing an exact search can be specified very precisely within the set boundaries. This way the connections between all kinds of people are getting tighter, while the different characteristics of these people can simultaneously be specified and examined.
Disadvantages:
One of the disadvantages of using network analysis is that people might have the tendency to solely focus on the big picture, thus neglecting all the small and sometimes personal/human factors that also play a role in a certain analysis. For example in the Florence Nightingale case, all the cases of mortality are being compiled in a massive death database where every single number represents the death of a human being. By looking at the loss of life in such a calculating way might invoke a certain utilitarian viewpoint that is considered immoral or unethical by some.
One of the more dividing disadvantages of network analysis is that researchers only look at networks for reaching their conclusions; thereby overlooking a rather significant number of people that do not participate in those kind of networks. A very relevant example can be shown with online network analysis: because before people can get online they must have access to a number of (digital) resources that require a certain set of funds and skills. Some people simply dont have these and consequently can not be a part of these networks, or the resulting analysis.
Those who are most deprived socially are also least likely to have access to digital resources such as online services." [20]
So the people that are already on the fringes of (online) society are getting more and more polarised because of the disadvantages they have for getting acces to certain networks. And when the instruments that the majority of researchers use include a lot of network analysis, these people wont get included in the result. So they wont get the benefits that can be accomplished by doing these kind of studies.
This study has shown that digital disengagement is persistent and related to social disadvantage. The implications of these findings indicate that digital disengagement is not simply an academic issue of little relevance to social policy technology and social disadvantages are inextricably linked. This means that social policy goals will be increasingly difficult to realise as mainstream society continues to embrace the changes in our information society while those on the margins are left further behind disengaged digitally, economically, and socially.[20]
Case examples and tools
Visualization as research method:
Presentation of data, communication of data. It is strong to the notion of exploration and all about learning something about the data. Underlining the visualization tools as ways to get to research. It becomes an interactive process, by trying to find out things in the data.
There have been several studies using visualizations to explore relations, in networks. Social network visualizations have always been popular. In these visualizations the relations with people to x fulfill a central role. Through the years there have been many different kinds of x-es. The social has been brought into relation with politics, diseases, war, economics, art and other social elements such as friendship connections.[21]
Case examples
Florence Nightingale:
One of the first used network graphs were used by Florence Nightingale. She was able to convince and change a lot through the usage of statistics and the visualization of a network. She was able to show the correlation between the organization of the military (or lack off) and the mortality rate. She used visualization to demonstrate the hidden killer in the army, and vastly decrease the mortality rate.[22]
(The figure below shows the total mortality rate, the darkest outer one are the numbers that could have been prevented).
Politics:
In the American elections, network visualization has been used to link certain words and ideas. Republican or democratic sides were linked to words by counting the number of mentioning. This visual helps to see connections between thoughts and sides, a representation of topics?
Friends and social:
Geographical History?
An interactive graphic displaying the number of friends and showing possible (historical) relations to specific countries.
Relations in the Bible:
Using a program called many eyes it was able to map relations in the New Testament.
Linked-In:
Tools
- Gephi: makes it able to create complex network visualizations
Influential thinkers in literature
Journals The network community has produced scholarly journals, such as Connections (founded by Barry Wellman), Social Networks (founded by Linton Freeman) and Social Structure (founded by David Krackhardt).- Connections http://www.insna.org/connections_archives.html
- Social Networks http://www.journals.elsevier.com/social-networks/
"The most direct way to study social structure is to analyze the patterns of ties linking its members. Network analysts search for deep structures - regular network patterns beneath the often-complex surface of social systems."Moreno would later add another innovation, namely the sociogram, to his Vitea. That would be a systematic method for graphically depicting the interpersonal structures of groups representing individuals as points and relationships as lines linking between them (Wasserman and Faust 1994). His approach would eventually lead to modern social network analysis. Sociologist Barry Wellman is another prolific scholar in the field of social network analysis. Wellman is quite famous for his international organization that strings Social Network Analysis researchers together. INSNA, a acronym for International Network Society of Social Network Analaysts, is still very influential in the field of social network analysis.. And so is Wellman. Wellman published many research on network analysis (more than 300 articles, chapters, reports and books). He thought of countless new concepts, such as networks of networks and personal community. INSNA website: http://www.insna.org/index.html
"Harvard's sociology department became a centre of social network analysis under the leadership op Harrison White. This time period at Harvard has been highlighted by many as the critical moment in network analysis."Under the supervision of professor Harrison White, many Harvard students have published in social network analysis. Barry Wellman was one of them. White wrote a book in which he demonstrated the use of mathematics in sociology, but he is mostly praised for his research with students. More specific: his work on roles and positions. Boorman, White. Social Structure from Multiple Networks http://www.jstor.org/discover/10.2307/2777596?uid=3738736&uid=2129&uid=2&uid=70&uid=4&sid=21102667490207
Heil, White. An algorithm for finding simultaneous homomorphic correspondences between graphs and their image graphs http://onlinelibrary.wiley.com/doi/10.1002/bs.3830210105/abstract Albert-László Barabási is among the most prominent researchers who have investigated the fault-tolerance of huge networks (2004: 126). The physicist - known for his concept of scale-free networks and his work in the research of netwrok theory aimed at a broad interdisciplinary approach to the "social network" as a research field of sociology (34). He completed Scale-free networks in 2003. Barabási and his research group introduced in their mathematical model "in systems developing uncontrolled, thus naturally, relations are not established accidentally, the newcomers typically connect to previous nodes." According to Barabási social and biological networks have a power-law distribution. Scale-free networks http://www.sciencemag.org/content/325/5939/412.short
Literature
[1] Luke, DA., Harris, JK. Network analysis in public health: History, methods, and applications. Annual Review of Public Health, 28 (2007): 69-93
[2] Buchanan M. Nexus: Small Worlds and the Groundbreaking Science of Networks. New York: Norton, 2002.
[3] Freeman, LC. The Development of Social Network Analysis: A Study in the Sociology of Science. Vancouver, Can.: Empirical, 2004.
[4] Newman, M., Barabási, AL., Watts, DJ.. The Structure and Dynamics of Networks. Princeton, NJ: Princeton Univ. Press, 2006.
[5] Freeman LC. Some antecedents of Social Network Analysis. Connections, 19.1 (1996): 3942.
[6] Moreno, JL. Who Shall Survive? New York: Beacon, 1934
[7] Wasserman, S., Faust, K. Social network analysis: methods and applications. In: Structural Analysis in the Social Sciences, ed M. Granovetter. Thousand Oaks, CA: Sage, 1994.
[8] Granovetter, MS. The strength of weak ties. Am. J. Sociol., 78.6 (1973): 136080.
[9] Kathrine Slettevold. Det sosiale nettverket i en læringsplattform. En sosial nettverksanalyse av kommunikasjonen i Classfronter mellom elever og lærere i en videregående klasse. Master thesis. University of Bergen, 2006. Web. 21 Sept. 2013. [10] Hilstad, Solveig Elsaas. Aktør-nettverk teori. 2001. Web. 21 Sept. 2013. [11] McCarthy, Caroline. Facebook: One Social Graph to Rule Them All? CBSNEWS 21 Apr. 2010 : 1. Print. [12] Grandjean, Martin. Facebook friends network mapping: a Gephi tutorial. Pegasus Data Project 26 Jan. 2013. Web. 21 Sept. 2013. [13] Barnes, John. Class and Committees in a Norwegian Island Parish. Human Relations 7, (1954): p. 39-58. [14] Scott, John. Trend Report Social Network Analysis. Sociology. Volume 22, Issue 1, (1988): p. 109-127. [15] Moreno, J.L. Who Shall Survive? New York: Beacon House, 1953. [16] Bavelas, A. A Mathematical Model for Group Structure. Applied Anthropology 7, (1948): p. 16-30. [17] Festinger, L. The Analysis of Sociograms Using Matrix Algebra. Human Relations 2, (1949): p. 153-158. [18] Newman, M. The Structure and Function of Complex Networks. SIAM Review, Volume 45, Issue 2, (2003): p. 167-256. [19] Serrat, Olivier. Social Network Analysis. Digital Commons, Cornell University, 2009. [20] Helsper, E. J.Digital Inclusion: An Analysis of Social Disadvantage and the Information Society. London: Communities and Local Government ,2008. [21] U. Brandes, P. Kenis and J. Raab (2006) Explanation Through Network Visualization. Methodology 2(1), pp. 16-23 [22] L. Brasseur (2005) Florence Nightingale's Visual Rhetoric in the Rose Diagrams. Technical Communication Quarterly 14(2), pp.161-18| I | Attachment | Action | Size | Date | Who | Comment |
|---|---|---|---|---|---|---|
| |
may_network_1.jpg | manage | 168 K | 22 Sep 2013 - 22:17 | SerkanYildizeli | |
| |
may_network_3.jpg | manage | 95 K | 22 Sep 2013 - 22:20 | SerkanYildizeli |
- Searching & Collecting
- Journal Guide
- Web & Blog Guide
- Research Communities
- Amsterdam Scene
- Amsterdam New Media Industry
- New Media Events
- New Media Methods
- Visualising Theories
- Key Works
- Academic Writing Guide
- Data Tools
- Data Visualisation
- Web Stats
- Research Apps
- Secondary Social Media
- Privacy
- Collaboration
 Copyright © by the contributing authors. All material on this collaboration platform is the property of the contributing authors.
 Ideas, requests, problems regarding Foswiki? Send feedback


