Examining Web Detection Algorithms
Team Members
Janna Joceli Omena, Eduardo Leite, Ángeles Briones, Scott Rodgers, Simon Ceh, Giulia Tucci, Michael Achmann, Dan Dai
Poster: TBAContents
Summary of key findings
This project report highlights three primary findings concerning Web Detection Algorithms (WDA). It presents (1) an updated definition of web entities and their purpose, (2) revealing a key methodological affordance for using web detection algorithms related to the currentness and relevance of the topic under investigation within the web environment. Finally, it provides (3) empirical evidence showcasing the efficacy of computer vision networks as powerful tools for mapping online issues and visual vernaculars across various platforms.
-
Web entities are real-world representations found on the internet. These entities can be semantic, reflecting contextual information of online images, and non-semantic, involving classifications labelling what is in an image, like font and product. This definition sets entities apart from AI image classification models, as they offer web references to images, enabling a more nuanced visual analysis of image collections. Because web entities extend image categorisation through web references, the outputs of web detection algorithms, such as when using Google Vision AI, are dynamic references that change over time.
-
Using web detection algorithms to make sense of online image collections has an expiration date. As WDA's outputs prioritise visible and current web references to an image collection, researchers should only expect in-depth or factual entities to classify an image collection that is fresh enough. Precisely because this type of output diminishes over time, resulting in a loss of detailed and contextual information about online images. Web entities are suitable enough to represent facts, topics, and concepts associated with the contemporary context of an image collection. In other words, WDA are most useful methodologically when researchers ensure that the times of image collection and detection are in close proximity.
-
Computer vision networks relying on WDA offer a novel way to study issue mapping and cross-platform visual vernacular. For instance, networks of images and web entities effectively map online issue spaces. In contrast, networks of images and URLs with matching images can show visual vernaculars across different platforms.
1. Introduction
Since 2015, numerous vision APIs have emerged, offering a wide range of services and generous free-trial packages, especially during their early years. Google Vision AI joined the scene in 2017, offering an exclusive web detection service empowered by its web AI knowledge. Industry professionals and scholars have extensively explored Vision AI's pre-trained ML models to derive insights and make sense of image collections (Mintz et al. 2019; Ricci et al. 2017, Schwemmer et al. 2020) while developing software to work with AI outputs (Chao, 2021; Chao & Omena, 2021).
Unlike image classification models, Web Detection Algorithms (WDAs) rely on web-based references and data repositories for their outputs. This feature allows practitioners to organize, visualize, and categorise visual data using contextual labels that provide information about facts and concepts shared across the web. The outputs of WDAs contribute to the study of image contexts, web visibility, and circulation, thereby advancing algorithm critique studies and supported by network visualisation (Baun & Schlüter, 2022; Omena et al., 2021; d’Andréa, 2021; Tucci, 2022). However, understanding and making sense of web detection algorithms is an ongoing challenge that requires dedicated attention and exploration. This endeavour goes beyond analysing top lists of web entities and the sites where image circulation occurs.
This project asks how we can advance meaningful research methods with WDAs. It aims to decode the methodological potential of Google’s visual intelligence. First, by moving network vision narrations techniques for qualitatively and quantitatively examining web entities and pages with matching images (circulation). Second, by developing temporal vision analysis to assess changes in dynamic and lexicon aspects of WDA outputs over time. Consequently, it involves a detailed analysis of WDA outputs and directs our vision to understand how web context and collective knowledge about specific topics change over time.
2. Initial Data Sets

-
Instagram images #femboy
-
12,542 Instagram images based on the hashtag #femboy were retrieved using the Visual Tagnet Explorer in February 2018.
-
WDAs' outputs from 2018, 2021, 2022, 2023
-
-
Image dataset from Google Images on "climate emergency"
-
992 images curated by searching for the keyword "climate emergency on 2019 using Google Image Search URL Extractor
-
WDAs' outputs from 2021, 2022, 2023
-
-
ChatGPT cross-platform-related imagery
-
2009 images curated by searching for the keyword "ChatGPT" on the search engine in the following webpages: The New York Times, Getty Images, Know Your Meme and Imgur. Images were scraped with DownThemAll.
-
WDA's outputs from 2023
-
3. Research Questions
-
What can network vision descriptions and narrations tell us about web entities and pages with matching images (circulation)?
-
How are changes in web entities over time? What insights can we gain from that?
-
What are the commonly observed authoritative sources (e.g., Wikipedia, Social Media) in WDAs outputs, and what categories of web pages typically appear below these sources?
4. Methodology
This project’s methodology builds on previous research on cross-vision API studies and digital methodologies for building, visualising and narrating computer vision networks.
The project relies on Network Vision Analysis to qualitatively and quantitatively describe and interpret the outputs of Google Vision (GV) web detection methods. This analysis provided a close reading of web entities and their changes over time. The project also reports changes in web entities over time through Quantitative Vision Analysis.
4.1. Network Vision Analysis
In this section, we worked on the ChatGPT and Climate Emergency datasets.
Building the Networks
With the images downloaded in a folder, we used Memespector GUI to access the Google Vision API on both datasets to work with the given outputs. The Climate emergency dataset was run on GV in 2021, 2022, and 2023, and the ChatGPT dataset only in 2023.
With every GV .csv output, we used Table 2 Net (Jacomy, 2013) to generate bipartite networks in which the nodes represent the images and their related web entities and networks with the images and their corresponding full-match image domains. After downloading the networks generated by Table 2 Net, we used Gephi to visualize and spatialize these networks. We ran the Force Atlas 2 (Jacomy, Venturini, Heymann, Bastian, 2014) algorithm to shape the network and ran Modularity to group and identify clusters within the network.
We then filtered the networks according to the clusters in which Modularity places the nodes so we could zoom in on them and do a more in-depth analysis. For this part of the analysis, we built eight different networks. Two to represent the ChatGTP dataset, one for web entities and another for circulation. The other six related to the Climate Emergency dataset, related to every Google Vision output we had through the years, so three web entities network (one of each referring to 2021, 2022, and 2023) and another three circulation networks (one for each year as well).
The Climate Emergency and ChatGPT datasets output from 2023 were analyzed by identifying the images placed in each cluster, their related web entities, and the sites of circulation of such images. We then compared the Climate Emergency 2023 networks and the networks from previous years to comprehend how these outputs change over time qualitatively.
4.2. Quantitative Vision Analysis
Initially, an exploratory data analysis was conducted, described as follows. To identify the frequency of occurrence of unique labels and web entities per year, resulting of the image processing with Cloud Vision API, as well as to compare the labels and entities assigned to the images, the CSV files from each year resulting from the computer vision analysis were processed in RStudio using the data.table (Dowle and Srinivasan, 2017), Tidyverse (Wickham, 2021), and stringr (Wickham, 2022) packages.
-
Description of Entities (over time)
-
Description of URLs (over time)
-
Comparison Entities/Labels
The quantitative results led to the mapping of web entity deletions and the close reading of four entities deleted over time: cross-dressing, LGBT, Transsexualism and Trans Woman.
5. Findings
5.1. Network Vision Analysis
In this section, we thoroughly analysed the web entities related to the ChatGPT multiplatform dataset and the Climate Emergency dataset from Google Images.5.1.1 Network of Chat GPT images sourced from multiple platforms and associated web entities
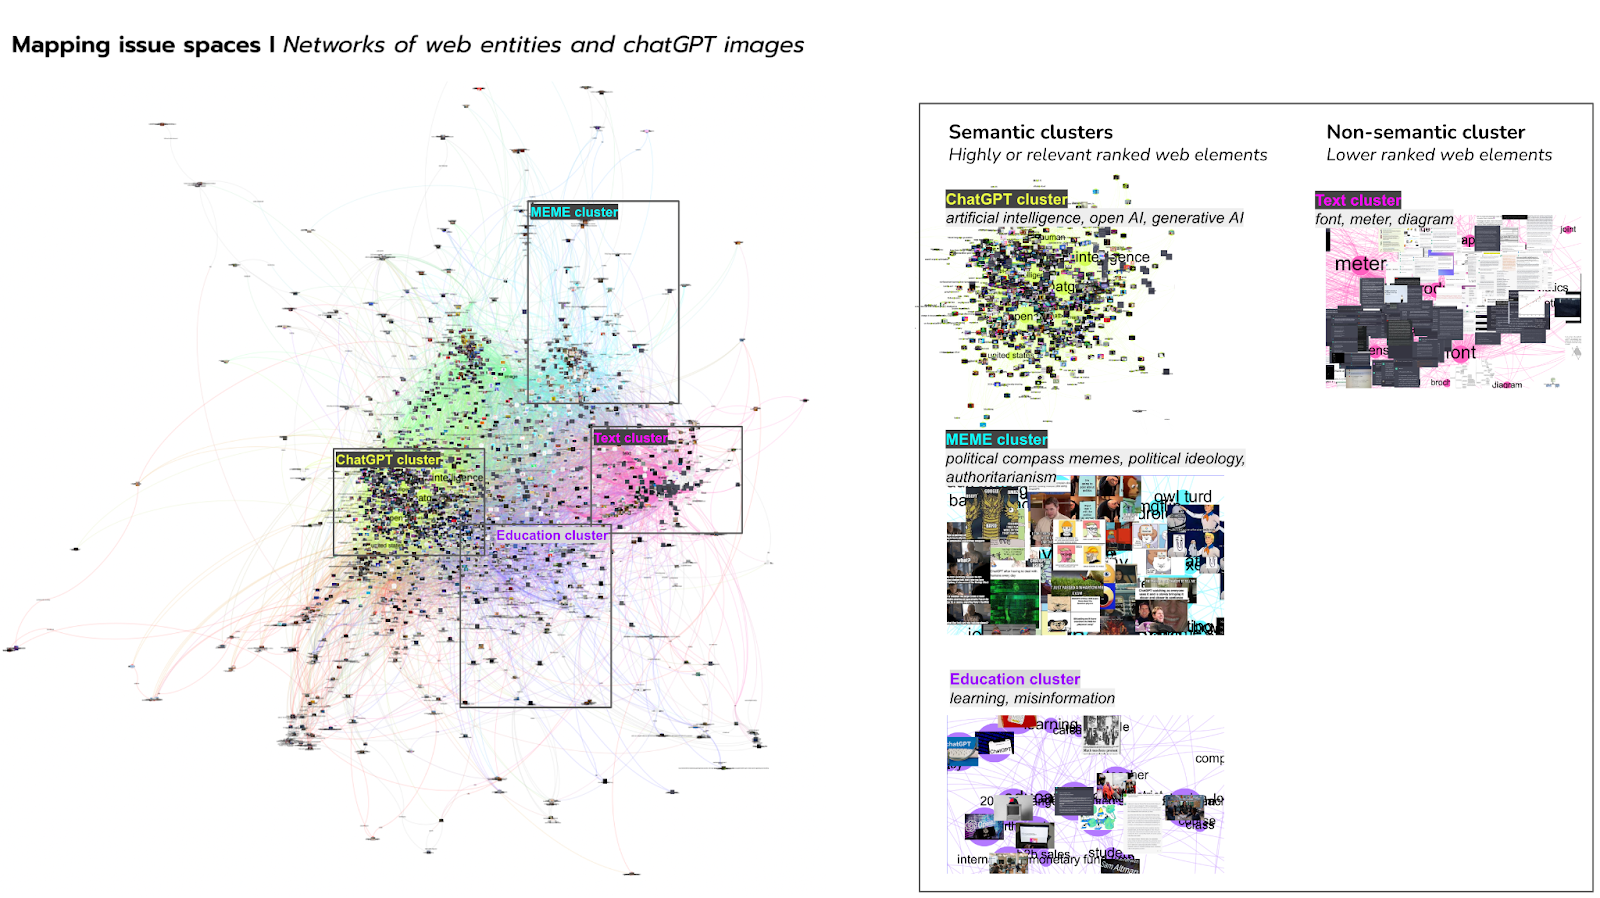
Fig. 1 - Web-entities network from Google Vision Outputs to the ChatGPT image dataset. Image collection curated in June 2023. The network is shaped using ForceAtlas2 and colour-coded based on modularity.
The main cluster of this network, in green, is composed by a relatively coherent group of stock images (e.g. smartphone screen showing the ChatGPT logo). They are grouped with web entities such as chatgpt, artificial intelligence, and openai. The more semantic names of these web entities appear to indicate an issue space around the release and implications of ChatGPT. This issue space likely emerges from images in this cluster being found in contexts such as recent news stories, which contain information that Google Vision ranks highly with regard to relevance. Web entities identified by Google Vision can reveal prominent issue spaces, particularly when image collections relate to recent news events or public issues.
The purple cluster shows a smaller concentration of stock images, screenshots and some image macros overlapping with web entities such as education, learning and misinformation. The images here are not dissimilar to those clustered around chatgpt and related web entities. However, the names of the web entities instead indicate an ‘education’ issue space, most likely because their web environment includes sufficiently rich semantic information to form a separate cluster. The visual web can also reveal smaller and more thematically specific issue spaces of web entities and images, provided that they are found in a sufficiently distinct semantic environment.
The light blue cluster sows images that most sighted human users would instantly recognize as ‘memes’, clustered with web entities such as meme, internet meme and know your meme. Predominant here are image macros, likely due to a surrounding semantic context (e.g. the Know Your Meme internet database), but also potentially due to non-semantic information such as image detection data. Other memetic images such as screenshots (discussed in the text cluster), or political compass memes, are meanwhile less present or absent. Political compass memes, for example, are found in a separate, small cluster associated with political spectrum, political ideology, and authoritarianism. This is likely because those images appear in thematically distinct semantic environments (e.g. in a specific subreddit). Google Vision can only partly cluster meme images, depending on what web elements are seen as most ‘relevant’ (according to Google) in the memetic image context.
The pink cluster concentrates screenshots and mainly comprises generic web entities such as text, font, and screenshot. These images, presumably of ChatGPT users’ results, represent an increasingly ubiquitous form of visual ‘quoting’ (Frosh, 2018). Although some screenshots also appear in different, more semantically-named clusters of web entities, the high concentration leads us to speculate that when images appear in contexts with little semantic information, Google Vision more highly ranks non-semantic information such as tags in web markup language, or detected probable image attributes. Yet, lower ranked and smaller nodes in the cluster are often more semantic web entities. For certain image clusters, Google Vision’s most highly-ranked web elements may be generic, and to human users thematically incoherent. These clusters can however be further clarified with reference to lower-ranked web elements.
5.1.2 Network of Chat GPT images and pages with fully matched images (circulation)

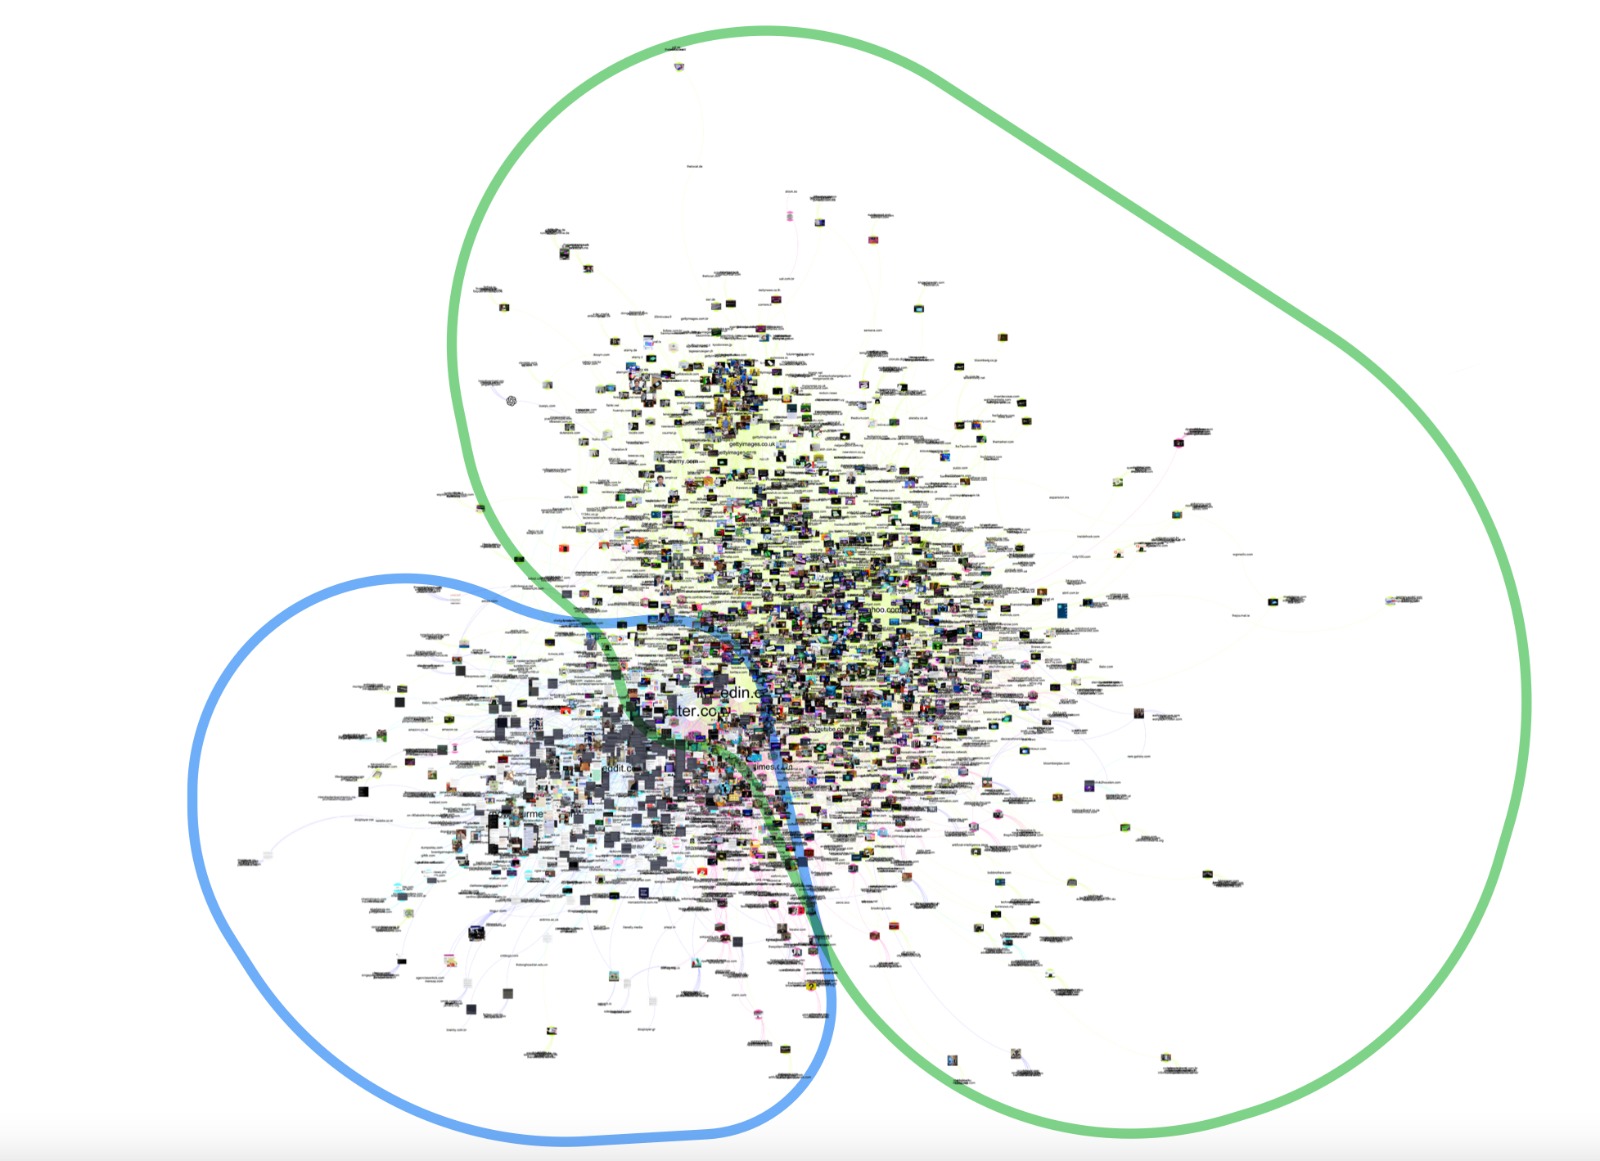
Fig. 2 - Full-matching pages from GV Outputs to the ChatGPT dataset
The images of the Chat GPT dataset circulate mainly in two types of websites. The first one, inside the green circle, are clusters of URLs and full matching ChatGPT -related images from the New York Times and Getty Images collections. We group together and isolate these two collections since they were found through closer inspection to share a broad image vernacular, associated especially with images produced or licensed for news and related forms of online publishing. These images primarily circulate through a network space made of news websites (e.g. nytimes.com), news aggregators (e.g. yahoo.com), stock image databases (e.g. gettyimages.com and alamy.com), and particular social media platforms (notably linkedin.com and twitter.com). The strong presence of news/stock images relating to ChatGPT and related topics on LinkedIn and Twitter may be explained by news-sharing practices among the professionals strongly present within both of these platform’s user bases.
Inside the blue circle, are the images from the Know Your Meme and Imgur collections. Closer inspection revealed that these two collections shared an image vernacular associated with the production, categorizing, and sharing of user-generated images. Contrasted with the news/stock image network space, social/UGC images primarily circulate through user-curated databases (e.g. knowyourmeme.com and imgur.com) and various social media platforms (e.g. reddit.com, facebook.com, linkedin.com and twitter.com). While Reddit shows a much stronger concentration of such social/ugc images, LinkedIn and Twitter show a concentration of these images alongside news/stock images. This suggests that the user bases of these platforms form a pivot between sharing news stories and sharing such content as image macro memes and screenshots. Curating image collections with distinct image vernaculars can allow researchers, using Google Vision’s capacity to detect URLs with full matching images, to examine and better understand the circulation of such image vernaculars across specific platforms.
5.1.3. In-Depth Exploration of the Top-9 Modularity Classes (Climate Emergency 2023 Dataset)
In order to investigate the Web Entities Network, we started off by loading the network into Gephi. The network has previously been clustered using the modularity function. It resulted in a total of 28 modularity classes. Once the nodes and edges have been colored using the modularity classes some clusters become clearly visible. Through the next steps, we concentrated on the top 9 classes, which make up 80,15% of the total network.
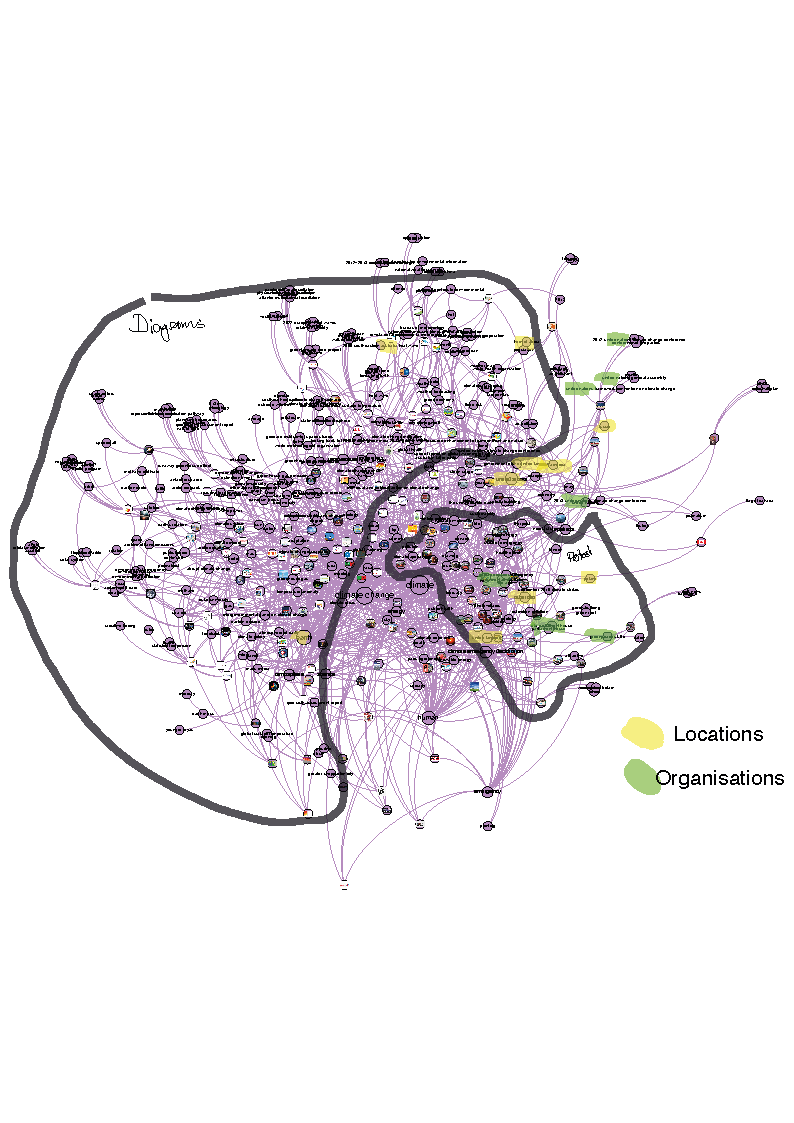
Fig. 3 - 1st cluster from the Climate Emergency Web Entities network from 2023 GV outputs
Mod. Class 20: Climate (Change)
This subnetwork revolves around the central terms climate change and climate. The cluster may be split into two smaller subclusters, on the left side we see mostly diagrams, while the right side shows images of protests. Looking at the entities, names of organizations (e.g. greenpeace UK, parliament) stand out in the right part of the network, mixed with locations (United Kingdom, Poland, …). These geographic locations are not limited to the protest part of the cluster, geographical entities spread across the top part of the network into the diagrams area. Here we see very specific mentions of climate change outcomes and how science takes track of climate change, e.g. through entities like weather, sun, atmosphere, biodiversity, and more. Throughout the whole cluster, there are scientific terms. Some location entities, like the United States and Europe, are located between the Protest and Diagram area, they are connected to images in both parts, thus we might infer how research, and protest both take place in these locations.

Fig. 4 - 2nd cluster from the Climate Emergency Web Entities network from 2023 GV outputs
Mod. Class 7: Text, Font, Meter
The second largest cluster revolves around the terms Text, Font, and Meter. Once more the main entities in this cluster have a label-like appearance. Through a visual exploration of the images in this cluster, three subnetworks appeared: The top-right part of the cluster surrounding the entity meter consists mostly of images and graphics often accompanied by short text as often shared on social media. Further, some book covers and diagrams are mixed into this part of the cluster. The entities in this part of the network are somewhat surprising: Except for textbook in connection with the book covers, terms like tuberculosis, anglican church, or special effects do not appear to have much in common. On the left-hand of the network, there is a majority of diagrams, or other image content typical for scientific publications and academic work like screenshots of presentations. The entities in this area revolve around scientific mathematical terms and paper. The bottom part of the network consists of company or group logos, paired with some country flags. The entities are between nonspecific visual terms (e.g. yellow, pattern) and over specific organisation names (e.g. geelong advertiser).
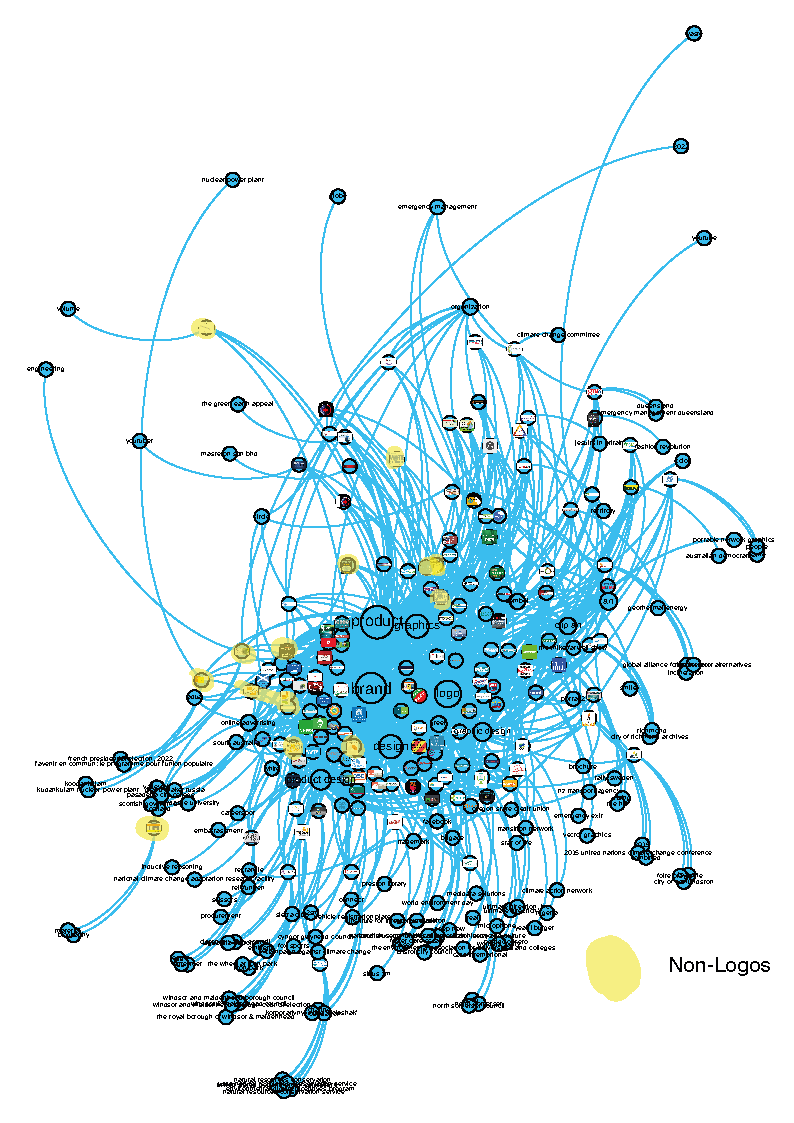
Fig. 5 - 3rd cluster from the Climate Emergency Web Entities network from 2023 GV outputs
Mod. Class 27: Product, Brand, Design
This class includes mostly logos and icons of brands and groups. There are few exceptions with images of a share-pic-like appearance, images with a combination of short text and graphics as commonly shared on social media. The entities are a mixture of terms referring to the appearance of the images, like clip-art, symbol, circle and very specific references to geographic locations or group names, like city of richmond archives, climate change committee, or preston library.
Mod. Class 23: Demonstration, Festival, Recreation
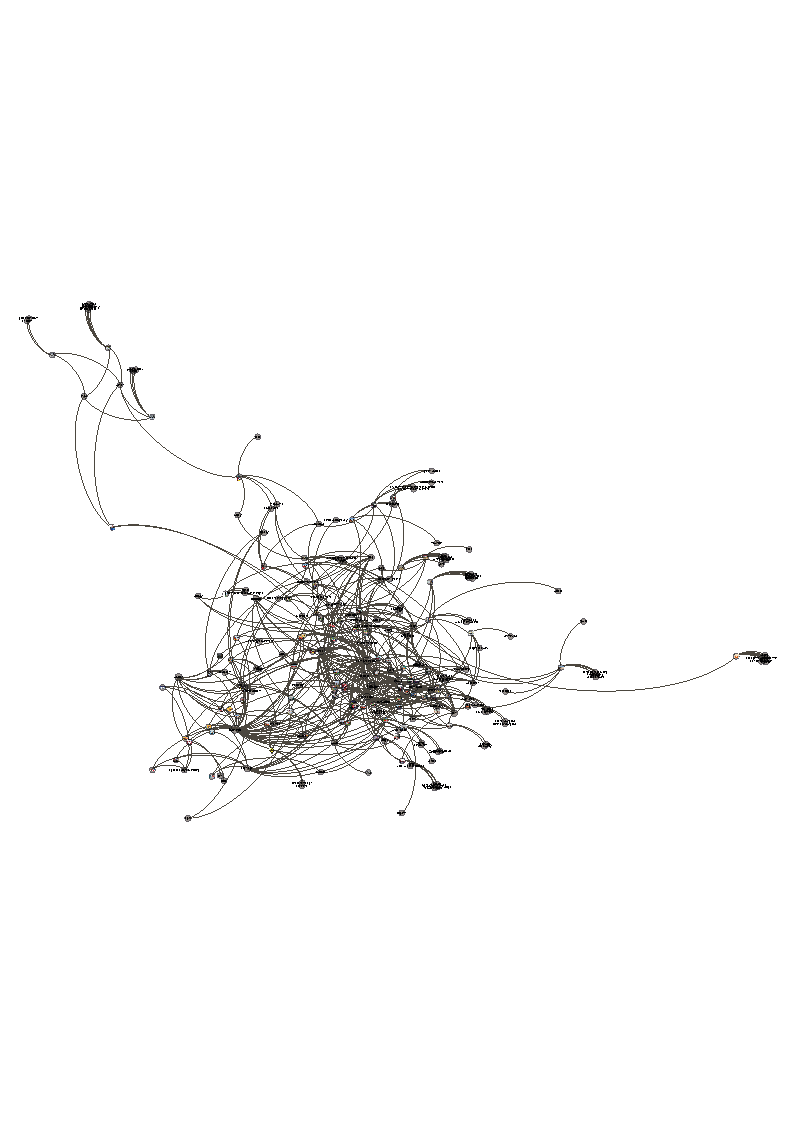
Fig. 6 - 4th cluster from the Climate Emergency Web Entities network from 2023 GV outputs
This class consists of banners at demonstrations, and "purely" digital banners. It does not clearly divide images of banners against images with protestors visible. While the major entities of the cluster are once more label-like (demonstration, crowd, recreation), there are several entities that describe the surroundings of demonstrations, like traffic sign, tree, or even locations like Melbourne. There are few outstanding nodes like capitalism, and anti-capitalism, as well as few references to social movements or specific groups.
Mod. Class 4: English, Fridays for Future
This cluster is the first one not to expose a label-like top entity, it’s rather a collection of entities surrounding Greta Thunberg, Fridays for Future and locations and languages. It doesn’t comprise many images (<50) and shows some country flags and some Friday for Future protests.
Mod. Class 12: Water
The cluster revolves around "water", as in drinking water and as a geographic reference. There are some landscape photos, some text, some images of climate change effects, and some weather forecast graphics.
Mod. Class 16: Transport
The cluster shows several entities surrounding different types of transport, as in e.g. public transport or bicycles. One interesting finding in this cluster is the emergency service node, which connects the modes of transport to the fire entity, which again connects to several other disaster entities. Picture-wise we see mostly wildfires in the disaster part of the network and vehicles in the transport part.
Mod. Class 5: Emergency, Safety, Management
The class revolves around environmental disaster and health. We see some of the effects of climate change through e.g. a poster with information on what to do in hot weather. Overall this class is rather heterogeneous.
Mod. Class 26: Facade, Architecture
This class mostly shows (urban) buildings. The entities revolve around architecture, building styles and epochs.
Mod. Class 25: Public Relation, Presentation, Speech
The images in this class are rather heterogeneous, yet they have in common that each of them either documents the information sharing process (i.e. presentations, speeches) or includes textual information itself. The web entities hardly are of any help for understanding this class’ content.
5.2. Temporal Network Vision Analysis
In this section, we explored the web entities related to the Climate Emergency dataset and websites in which GV identified fully matching images in three different years: 2021, 2022 and 2023.5.2.1. Comparison between web entity-image networks over time
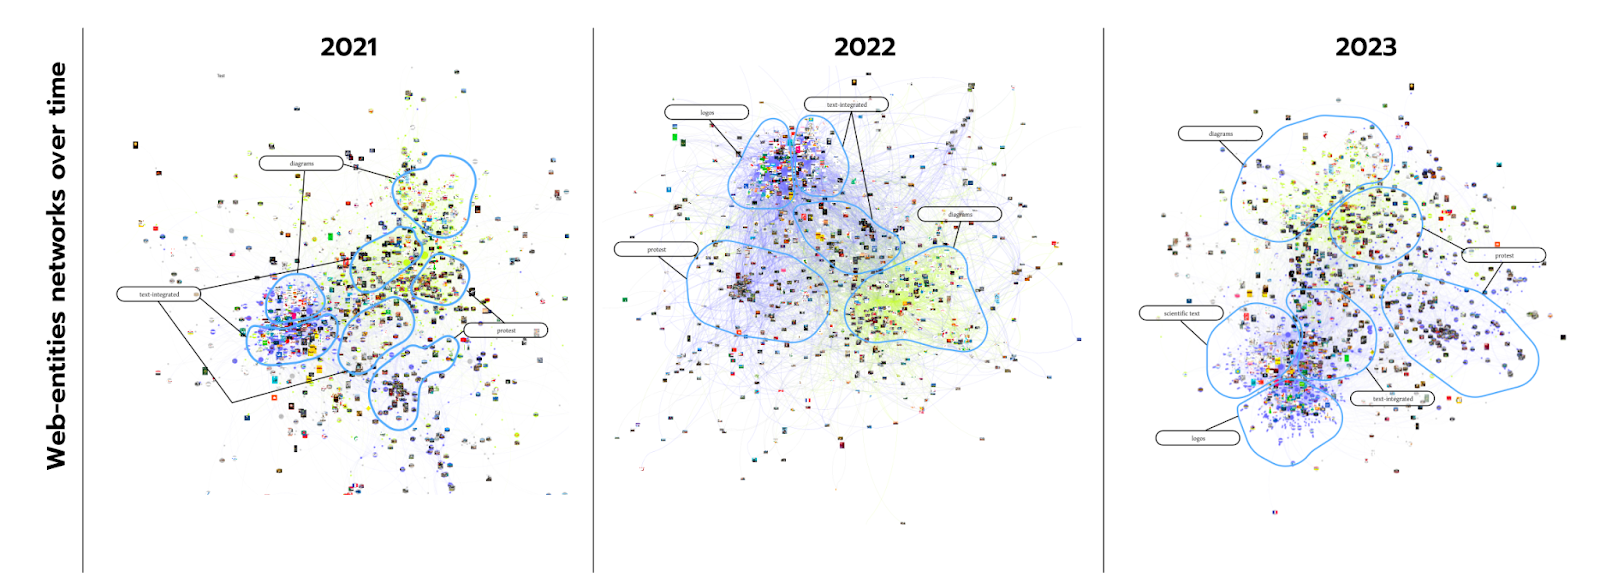
Fig. 7 - Web entity-image networks from Google Vision Outputs to the Climate Emergency dataset over time.
Following the characteristics of web entities, we first described the clusters of the three networks while observing the presence or absence of clusters containing more or less contextual web entities. We observed that the semantic-wise overlap between entity clusters started disappearing over time, and the increase of images clustered more powerfully based on image content (what is in an image) rather than semantic entities (e.g. people, facts, concepts, context related to an image).
We repeated the process with the older entity networks based on this in-depth analysis of one of the networks. We were able to spot differences between the networks in time. Images that easily can be distinguished by looking at them, like text, diagrams, or protest images, appear in the oldest network (2021) in different modularity classes. Their similarity in the network is based on semantic entities rather than the image content. The images started grouping in descriptive clusters in the later datasets, presumably based on image content. A qualitative exploration of the top-most modularity classes may observe the changes in the entities over time. Within several clusters there are one or more areas of images with similar content; we group them and name them, either in your notes or through annotation. Once the top-most classes have been explored in this fashion, zoom out and take a look at the whole network from a macro-perspective: In the entity-image network created closer to the time of data collection, we could spot images with similar content to appear in different entity-clusters. Over time, the content-wise overlap between entity clusters started disappearing, and the images clustered more powerfully based on image content rather than semantic entities.
5.2.2 Comparison between networks of climate emergency images and pages with full matching images (circulation) over time
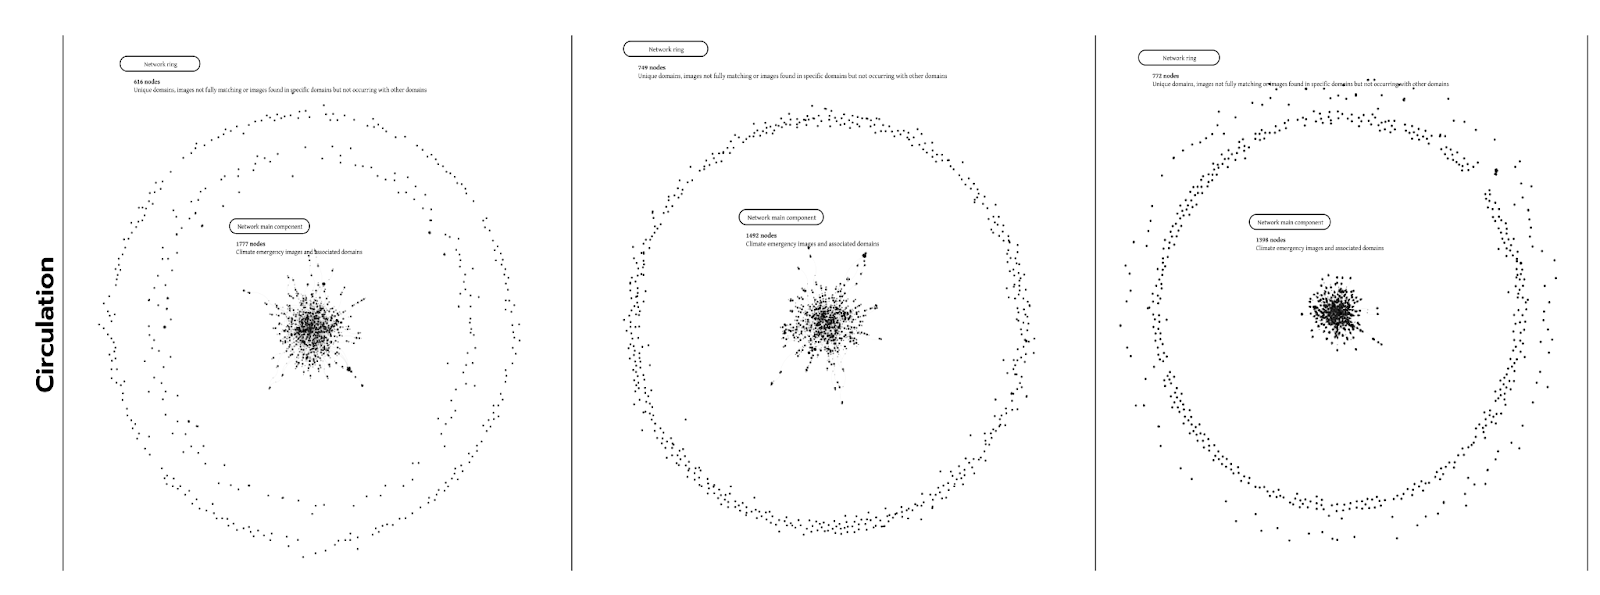
Fig. 8 - Networks of image circulation from GV Outputs to the Climate Emergency dataset over time (2021, 2022, 2023)
By looking thoroughly through the networks of image circulation from the Climate Emergency dataset over time, we realised that the same collection of images has less fully matching image outputs from Google Vision AI each year. This type of network is divided into two areas. The first one is the giant component of the network (represented by the subnetwork in the middle of the graph), which gathers together images with co-occurrent primary domains, i.e. fully matching images appearing on the same websites. The second one is the peripheral ring. It is formed by images that either don't have full-matching image outputs from GV or have particular domains that don't co-occur with any other image on the dataset.Over time, we can see that the giant component from the network shrinks while the peripheral ring increases. This shows that the climate emergency image collection loses newness over time, and the dataset created in 2021 becomes less visible or relevant content to be ranked as an authoritative source. As mentioned in the previous section, this can be seen or confirmed through increased non-semantic web entities over time.
5.3. Quantitative Vision Analysis
Descriptive analysis of Femboy and Climate Emergency image datasets
FEMBOY IMAGE DATASET
The Femboy dataset consists of images analyzed over four different years: 2018, 2021, 2022, and 2023. In total, there were 12,542 images processed with Cloud Vision API. Among these images, there were a total of 13,193 unique web entities and 2,307 unique labels. It's important to highlight that 1,606 of these labels also emerged as web entities, accounting for more than 50% of the unique labels.
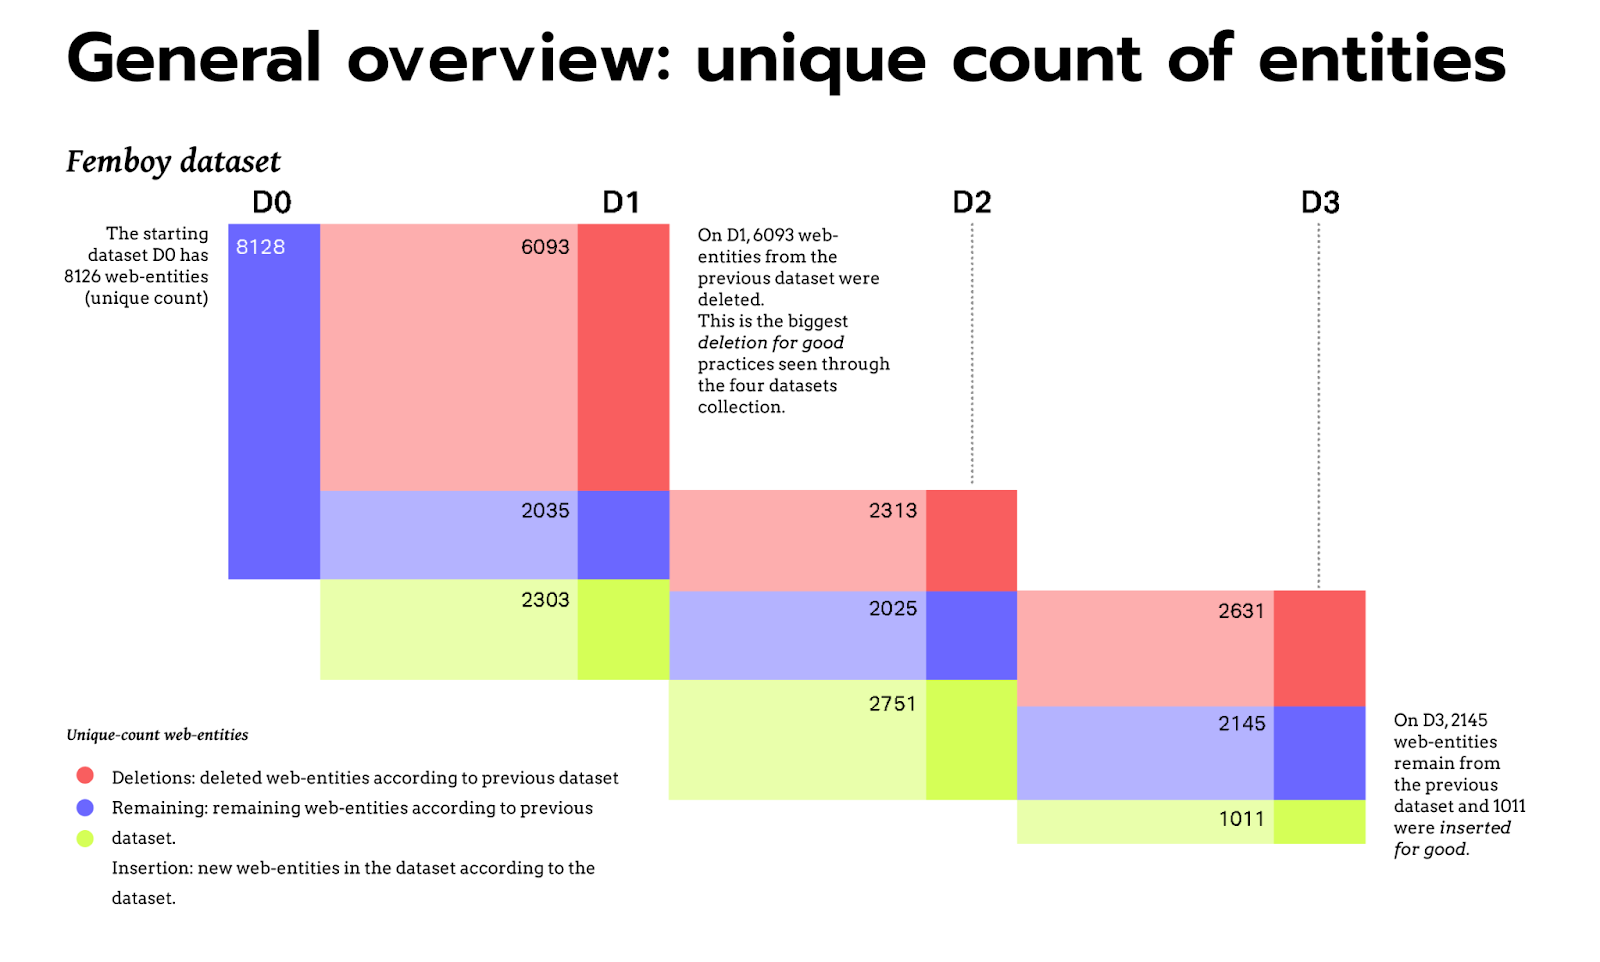
Fig. 9 - General overview: unique count of web entities and their insertions and deletions over time, from February 2018 (D0) to June 2021 (D1), December 2022 (D2) and June 2023 (D3).
Here is a breakdown of the results for each year:
- 2018 Results: In 2018, the dataset contained 8,106 unique entities and 1,739 unique labels.
- 2021 Results: For the year 2021, there were 4,302 unique entities identified along with 1,216 unique labels.
- 2022 Results: In 2022, the dataset included 4,758 unique entities and 1,282 unique labels.
- 2023 Results: Lastly, in 2023, the dataset consisted of 3,139 unique entities and 1,282 unique labels.
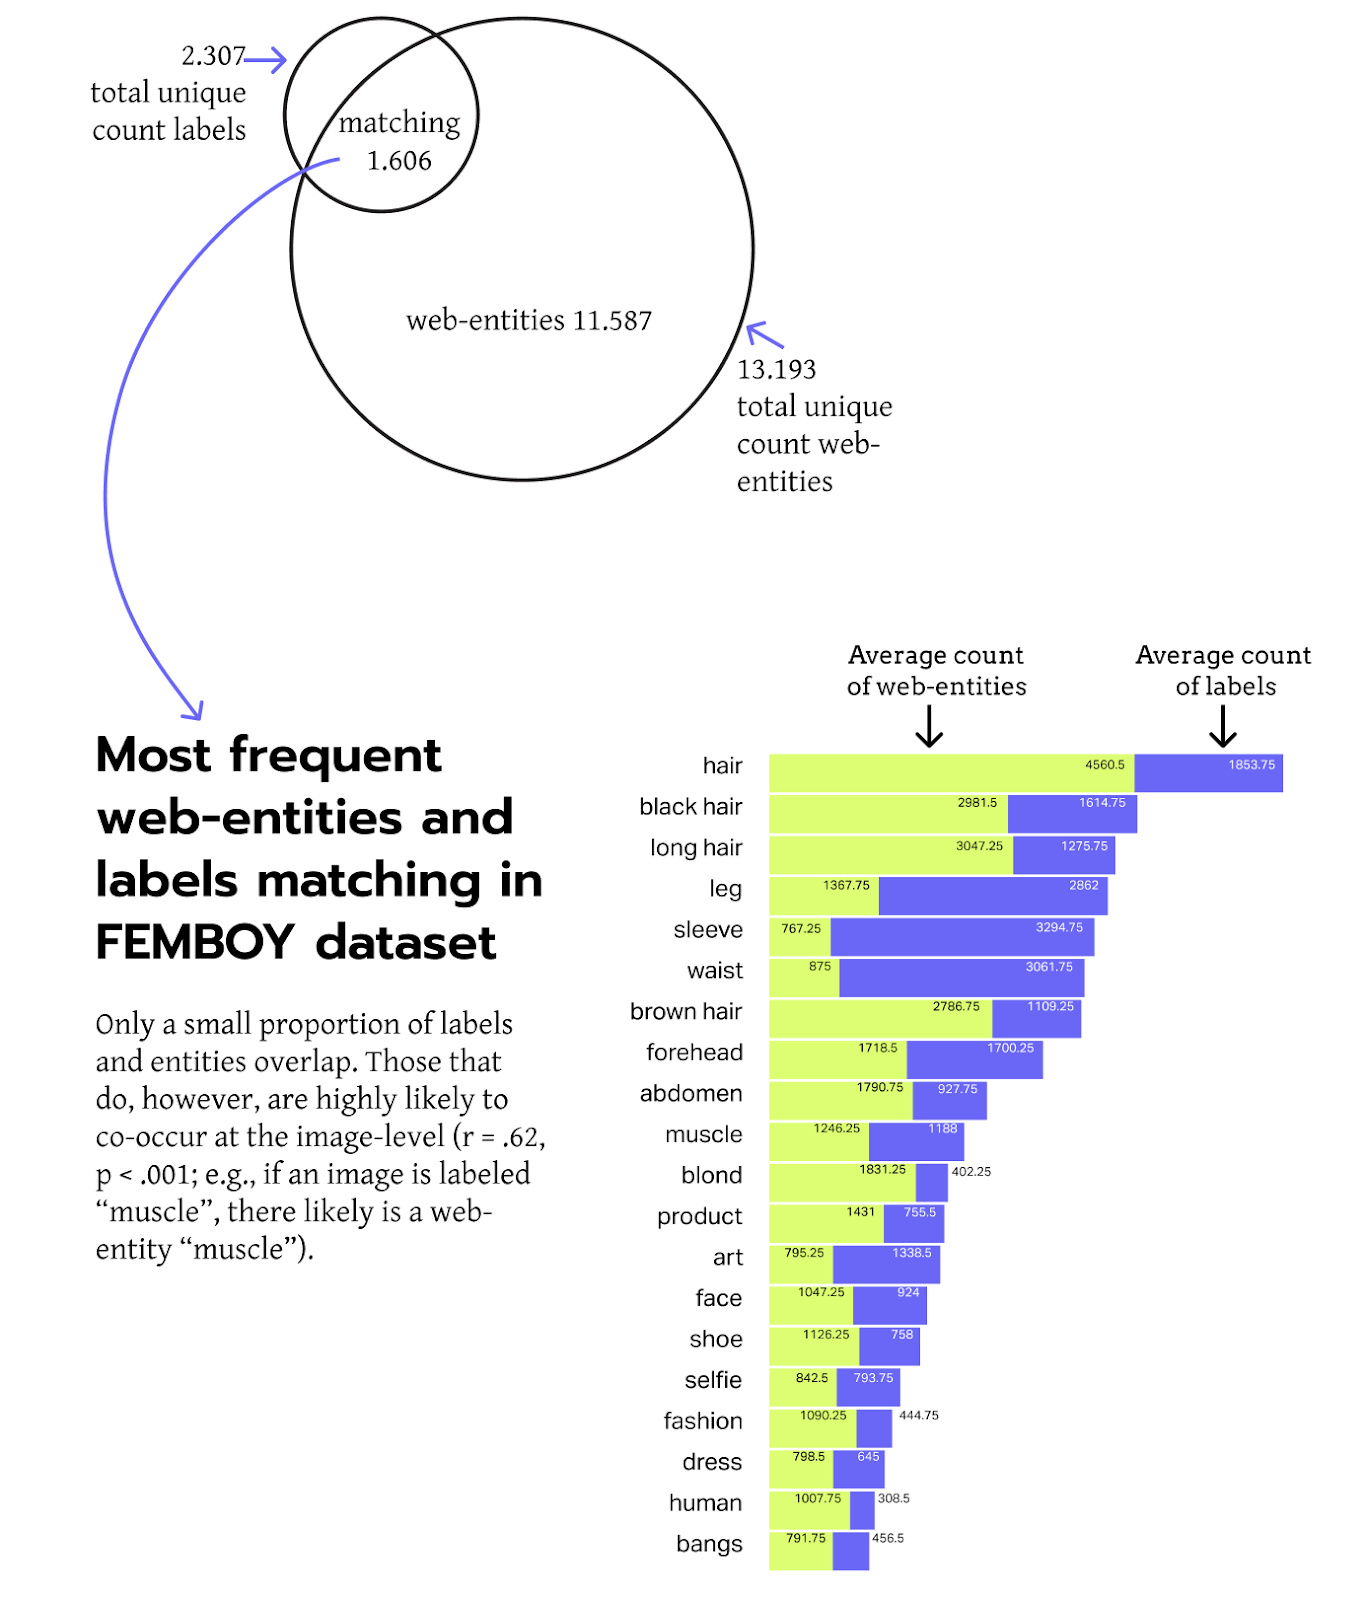
Fig. 10 - Total unique count of labels and web entities in the Femboy dataset
CLIMATE EMERGENCY IMAGE DATASET
The Climate Emergency dataset comprises 992 images that were analyzed over three different years: 2021, 2022, and 2023. Within these images, there were a total of 4,433 unique web entities emerged as well as 695 unique labels.
Here is a breakdown of the results for each year:
- 2021 Results: In 2021, the dataset contained 2,721 unique entities and 660 unique labels.
- 2022 Results: For the year 2022, there were 2,437 unique entities identified along with 659 unique labels.
- 2023 Results: Lastly, in 2023, the dataset consisted of 2,033 unique entities and 660 unique labels.
Temporal Vision Analysis: What are the prevalent categories of URLs over time?
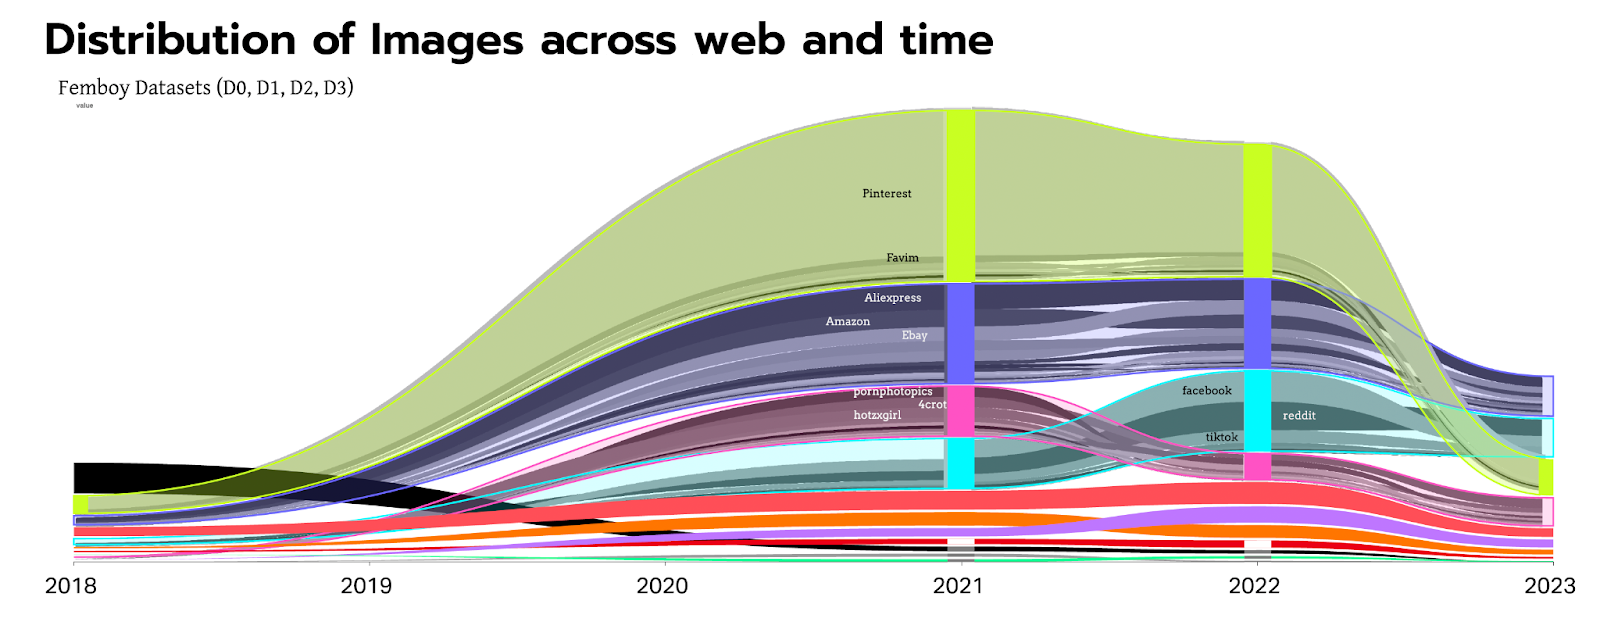
Fig. 11 - Distribution of images across the web and time. Femboy image datasets. The bump chart shows the most prevalent categories of URLs across the four-time points. Categories have been derived after an overview of the top 100 URLs (and only the top 100 were manually coded).
The distribution of images across image-curating sites, such as Pinterest (the most prominent platform in this category), DeviantArt, and Imgur, appears natural due to their content-focused nature, whereas social media platforms tend to be more person-focused. Within the porn category, it is evident that femboy content revolves heavily around sexuality and nudity. This raises concerns about ownership issues and ethical considerations. Whether the original content creators shared their work on porn sites is doubtful. Additionally, in terms of e-commerce, the web entity algorithm may detect and classify advertisements, but there is speculation that smaller e-commerce platforms may engage in picture theft (although this remains speculative and should be approached cautiously).
From quantitative to qualitative analysis
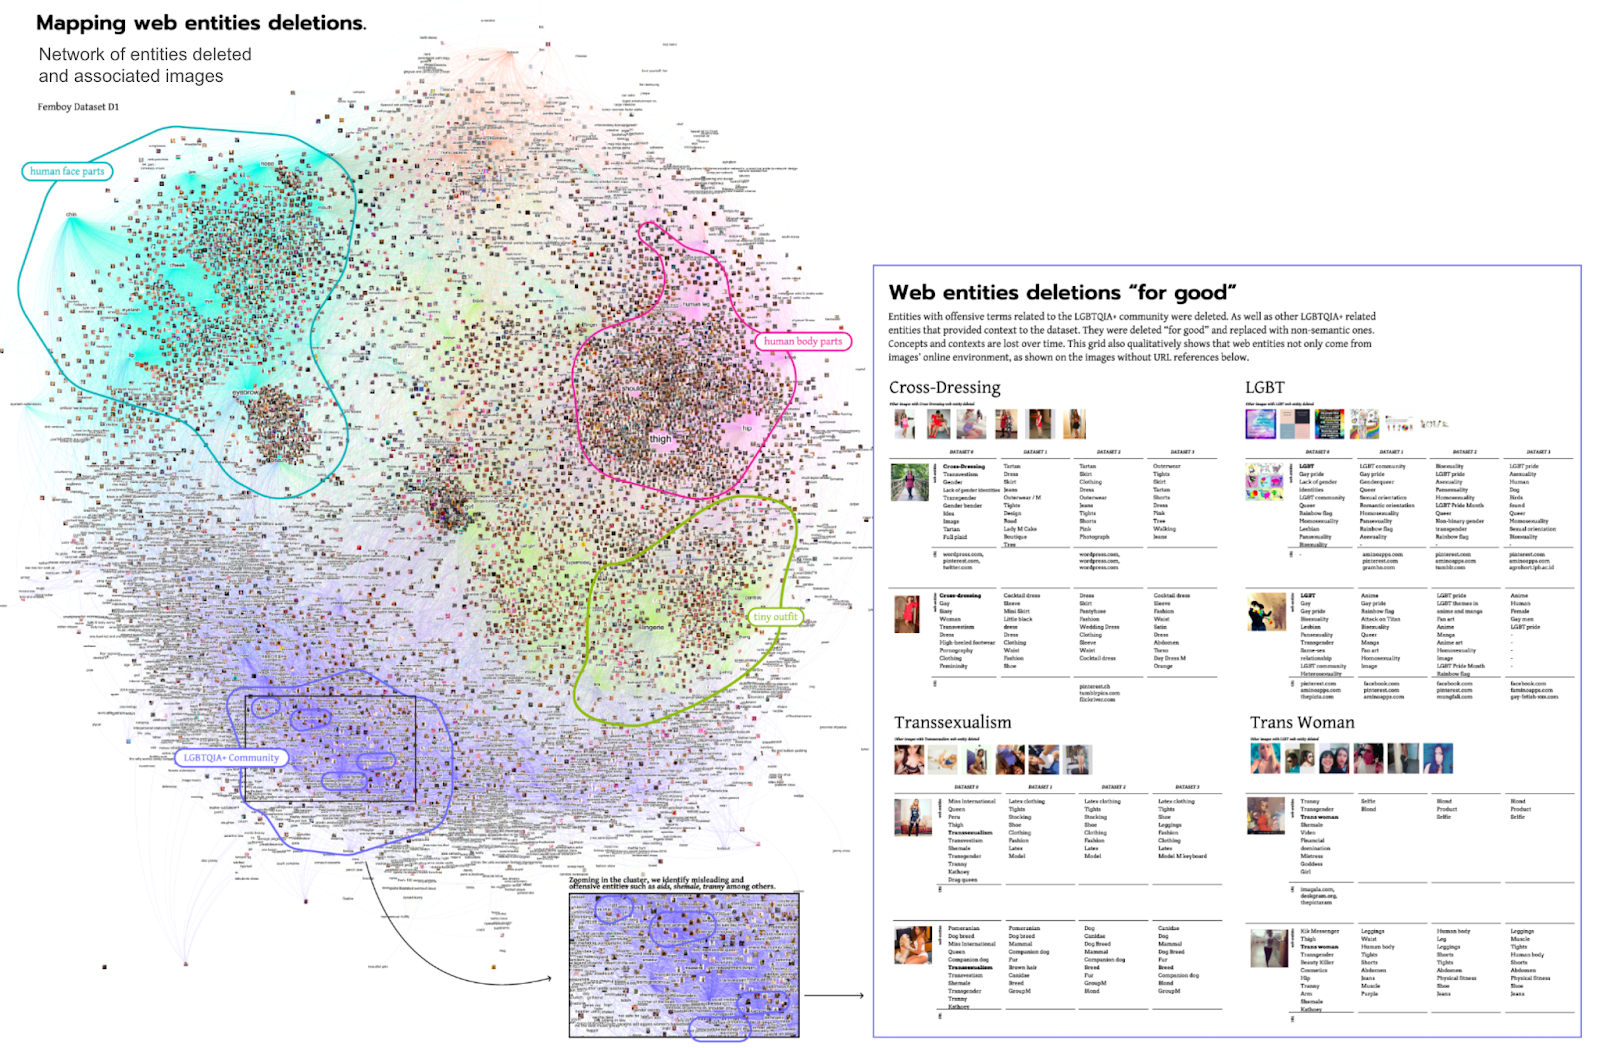
Fig. 12 - Web entities deletions “for good”. Quanti-quali network vision analysis.
After identifying that between February 2018 (dataset D0) and June 2021 (dataset D1) was the period with the biggest entities' deletion practice, we built a network with all deleted entities and associated images. Four main groups of images reveal the taxonomy of deleted entities revolving around human faces and body parts, underwear outfits and the LGBTQIA+ community. The latter image cluster served the analysis as a close reading of entities describing the LGBTQIA+ community: LGBT, Cross-dressing, Transsexualism and Trans Woman, which were deleted "for good" and replaced with non-semantic references.
On the one hand, deleting considered offensive entities to the LGBTQIA+ community can be seen as a positive aspect of WDA. For example, Femboy images are no longer referred to as lack of gender identities, tranny (a scornful term used to refer to a transgender person), shemale (a term most commonly used in the pornography industry to describe trans women, but in the transgender community is considered degrading). On the other hand, new and appropriated web entities are not used to classify the Femboy images. This result suggests that, in 2023, WDA cannot provide Femboy-specific entities to an image dataset created in 2018. It also highlights the lack of current and appropriate entities to classify Femboy-related images. Finally, with the image grid, we observed that web entities not only come from images' online environment (e.g. web content and digital objects surrounding images), as shown on the images without URL references below.
6. Discussion
Confidence score
While image classification labels can range from 0 to 1, the latter reflecting 100% certainty about a specific image label, web entities are normalized to an upper bound of 15. While it can be speculated that high scores reflect salient aspects of an identified website hosting the image in question, it is noteworthy that the highest scores were typically given to person entities (e.g., celebrities) rather than other categories (e.g., objects). Moreover, the data reveals that the normalization to an upper bound was introduced sometime between 2018 and 2021, as the first dataset contained some entities with even higher scores. Interestingly, some images also yielded web entities without being related to any URL, suggesting that in these cases, web entities might be retrieved from the original image web location (e.g., original post), could correspond to labels from the image classification (e.g., which entities are typically related to an image with certain labels), or stem from other sources / are based on different characteristics of an image. For the dataset of femboy images, the most prevalent entities were related to physical features, such as body parts or hair colour.
Overlapping between web entities and labels
Regarding the femboy dataset, there is only a small overlap between image labels and web entities provided by the web detection algorithm, considering the greater prevalence of unique entities. Still, a major part of image labels are also part of the web entities, and those units that do co-occur are also highly related in terms of count for the whole dataset (r = .63, p < .001). This suggests that while image labels are reflected in the web context, web entities provide a fine-grained contextualization.
Using web entities to analyze image collections over time
Using web detection algorithms to make sense of online image collections has an expiration date. This is shown in the image circulation networks over time (section 5.1.3), in which the giant component of the networks shrinks over time while the peripheral ring increases. Therefore, using web entities to contextualize images or studying online image circulation through detecting full or partial-matching images is efficient if done as close as possible to the image collection curation. It is interesting to ponder the mechanisms behind the component-time relationship. On the one hand, changes in the network structure could result from changes in how entities are detected through the algorithm (e.g., more detailed categorization). On the other hand, considering the loss of references over time, it could also reflect the loss of relevance of internet references for a given topic over time, indicating the short lifespan of online content.Methods observations when reading computer vision networks
-
Not every online image of an image collection receives web-references, which reflects non-semantic entity-image clusters. The lack of entities and URLs detected in a group of images may speak of (i) images coming from ordinary users' posts on social media, (ii) lack of source authority, relevance, or facts to Google's WDA, or (iii) may reveal an outdated online image collection.
-
Web entities that Google Vision API identifies can reveal dominant, smaller, and more thematically specific issue spaces. This is particularly possible when image collections relate to recent news events or public issues, and are likely to be found in sufficiently distinct semantic environments online (e.g. within news stories or focused social media threads).
-
Google Vision API will often rank more generic, non-semantic web entities (e.g., font, photograph, text, brand, brand). This may be related to less semantic content in the image web environment or a long time between image collection and Google Vision API detection, leading to higher rankings for non-semantic web entities.
7. Conclusions
This project conceptualizes and characterizes web detection algorithms provided by Google Vision AI, namely 'Web entities and page detection.' It contributes to developing meaningful research methods utilizing Web Detection Algorithms (WDAs) by offering comprehensive network visual narrations and qualitative and quantitative descriptions of multiple image datasets and their algorithmic outputs over time. Through this approach, the project facilitates in-depth observations of web entities, their transformations, and how they can reshape the interpretation of online image collections.
However, it's important to note that the web entities feature is currently only available through Google Vision API. Consequently, there is no basis for comparing the accuracy and relevance of the provided outputs with other APIs. Despite this limitation, web entities can be powerful tools for analyzing online image collections. Researchers must be cognizant of their dynamic nature; these classifications evolve, potentially losing semantic and contextual relevance as time progresses.Therefore, an essential conclusion from this project underscores the researcher's necessity to generate outputs from the chosen image collection as soon as the curation process is complete. This preemptive action can provide more accurate results and mitigate the impact of dynamic changes in web entities.
8. References
Baun, P. S., Schlüter, M. et al. (2022). Let's Play War. Inside 4chan’s intergroup rivalry, contingent community formation, and fandomized war reporting. https://wiki.digitalmethods.net/Dmi/SummerSchool2022chugginguhg
Chao, T. H. J. (2021). Memespector GUI: Graphical User Interface Client for Computer Vision APIs (Version 0.2) [Software]. Available from https://github.com/jason-chao/memespector-gui. Chao, T. H. J. & Omena, J. J. (2021). Offline Image Query and Extraction Tool (Version 0.1) [Software]. Available from https://github.com/jason-chao/offline-image-query. d’Andréa, C. et al (2021). Investigating cross-platform visual issuefication: the case of Brazil’s Pantanal wildfires. https://metodosdigitais.fcsh.unl.pt/?page_id=2327 Dowle, M. and Srinivasan, A. (2017), “data.table”, R, Rdatatable. Frosh, Paul. (2018), The poetics of digital media. Cambridge: Polity Press. Jacomy, M. (2013). Table 2 Net [Computer Software]. https://medialab.github.io/table2net/ Jacomy, M., Venturini, T., Heymann, S., & Bastian, M. (2014). ForceAtlas 2, a Continuous Graph Layout Algorithm for Handy Network Visualization Designed for the Gephi Software. PLOSONE, 9(6), e98679. https://doi.org/10.1371/journal.pone.0098679 Mintz et al. (2019). Interrogating Vision APIs. https://metodosdigitais.fcsh.unl.pt/?page_id=1212 Omena, J. J., Elena , P., Gobbo, B. ., & Chao, J. (2021). The Potentials of Google Vision API-based Networks to Study Natively Digital Images. Diseña, (19), Article.1. https://doi.org/10.7764/disena.19.Article.1 Ricci, D., Colombo, G., Meunier, A., & Brilli, A. (2017). Designing Digital Methods to monitor and inform Urban Policy. The case of Paris and its Urban Nature initiative. In: 3rd International Conference on Public Policy (ICPP3)-Panel T10P6 Session 1 Digital Methods for Public Policy. SGP, 2017. p. 1-37. Schwemmer, C., Knight, C., Bello-Pardo, E. D., Oklobdsija, S., Schoonvelde, M., & Lockhart, J. W. (2020). Diagnosing Gender Bias in Image Recognition Systems. Socius, 6, 2378023120967171. https://doi.org/10.1177/2378023120967171 Strohmaier, M., Walk, s., Poschko, J., Lamprecht, D., Tudorache, T., Nyulas, C, Musen, M. A., Noy, N. F. (2013) How ontologies are made: Studying the hidden social dynamics behind collaborative ontology engineering projects, Web Semantics: Science, Services and Agents on the World Wide Web. http://dx.doi.org/10.1016/j.websem.2013.04.001 Tucci, G. (2022).Visualizing an image network without rendering files: A method to combine user hashtags with computer vision labels. Dígitos. Revista de Comunicación Digital, 8: 109-126. DOI: 10.7203/drdcd.v1i8.237Wickham, H. (2021), “tidyverse: Easily Install and Load the ‘Tidyverse’”.
Wickham, H. (2022), “stringr: Simple, Consistent Wrappers for Common String Operations”.


| I | Attachment | Action | Size | Date | Who | Comment |
|---|---|---|---|---|---|---|
| |
WhatsApp Image 2023-08-29 at 14.53.40.jpeg | manage | 257 K | 29 Aug 2023 - 18:54 | EduardoLeite |
Ideas, requests, problems regarding Foswiki? Send feedback