Cross Vision-API Studies. Digital methodologies for understanding computer vision
Team Members
Janna Joceli Omena, Elias Bitencourt, Jason Chao, Ana Marta Flores, Rita Sepúlveda, Luca Draisci, Anton Berg, Minh Ngo, Eduardo Leite, Lara Dal Molin, Madeline Brennan, Jiri Svoboda, Danielle Games Cruz, Lishan Qin, Qingyue Du, & chatGPT (as technical glossary 😏).
Joint Winter School I DMI & #SMARTDataSprint ❣️💻✨✨ SubmissionsContents
Key findings
This project develops digital methodologies to understand computer vision labelling performance in classifying images using the outputs of four commercial machine learning models: Google Vision AI, Microsoft Azure, Clarifai and Amazon. Results show that vision API systems mostly don't share their understanding of the same ontological image properties/features. The statistical vision analysis results confirm that Google Vision AI, Microsoft Azure, and Amazon semantically disagree for most 9,930 processed images. Thus, the complexity of computer vision outputs needs to be considered and comprehended to avoid miss considerations of labelling (incorrect, biased, stereotyping). The temporal vision analysis exposes the ever-evolving landscape of Google Vision models over time yet lacks updates concerning gender specificity. For example, after improving the classification of images not containing “girls” but showing people self-identifying as femboys, the vision systems offer no replacement for previous gender classification. Instead, its taxonomy focuses on the human body and gestures. Below are findings of the descriptive profiling of cross-vision APIs with a basis on the network vision analysis.
| Describes and then interprets the image | Microsoft Describes what is in the image | Clarifai Describes what the images represent |
| I describe image elements, their qualities and infer their context without making assumptions about what the image represents. I am usually correct and give you a decent idea of what the image looks like. precise, calculated, estimation, plays it safe, inference, moderate abstraction | I produce precise descriptions of what is in the image, focusing on obvious elements and not making assumptions about meaning or context. I am inevitably correct but you will not know what the image is of. careful, detail of description, little abstraction | I describe some image elements but also attempt to infer context and further make assumptions about what the image represents. I love guessing contextuality and identifying complex themes, but I am often wrong. gambler, association, guessing, contextual, mislabelling, high abstraction |
Insights from Comparative Analysis of Vision APIs:
-
Clarifai goes beyond just describing the images and tries to guess their possible contexts in the real world, but such guessing is not always accurate or reliable. Such contextual labels remind us of Google Vision web entities. Clarifai outputs offer an extensive range of labels to describe the images. For example, despite having the most extensive labels among the three APIs, Clarifai is often incorrect about the labels given to images. At the same time, Google Vision API, which uses fewer labels to describe the same datasets, is usually correct.
-
Google Vision is more precise and identifies specific terms to describe images. Google Vision outputs show an exact and concise vocabulary.
-
Microsoft Azure uses the most conservative and generic language among the three APIs and does not go beyond broad descriptions. Here computer vision outputs also show the most generic language among the APIs we analysed.
About vision APIs taxonomies and layers of characterisation towards images of headshot pictures of women and men:
-
Despite the variety of labels in Clarifai, the subjective labels assigned to the Women and Men maps are unbalanced and lack common labels. There are 76 pictures of Men tagged as "woman", and 98 of Women pictures labelled as "man." 205 pictures in the Women dataset are tagged "adolescent" when pictures show arguably older women.
-
Microsoft maintains the descriptive nature of labels, while using fairly specific and rich vocabulary to describe, for instance, types of hairstyles (e.g. quiff, dreadlocks) or headwear (fedora, sombrero, ushanka). It tries to assign labels either to men or women, with very few impartial labels.
-
Google applies objective and descriptive taxonomy to label body parts, but the description's scope varies depending on gender. It also makes subjective inference such as occupation and produces gendered results.
Finally, this project suggests that digital methods research should move beyond measuring API vision systems by expertise levels (rookie, amateur or expert) or range of labelling. Our findings show that the number of labels identified by an API does not correlate to their precision. Instead, an acknowledgement of the API under use.
1. Introduction
In recent vision API studies, commercial vision APIs have supported several projects analysing online image collections. There is a focus on critique of the poor performance of computer vision and on conceptually resignifying its outputs with experimental methods (d’Andrea & Mintz, 2019; Mintz et al. 2019; Omena et al. 2021; Ricci et al. 2018; Schwemmer et al, 2020). But, less attention has been paid to developing a good understanding of the AI technique in use. While questions are raised about the analytical potential of computer vision outputs or the difficulties in interpreting these results.
As a response, this project aims at understanding computer vision representation schemes to classify images. It will focus on mapping AI taxonomies by using the outputs of machine learning models for classifying images and drawing on four commercial vision APIs: Google Vision AI, Microsoft Azure, Amazon (AWS) and Clarifai Computer Vision - moving beyond single-vision API studies. Furthermore, this project aims to understand how cross-vision-AI models “affect the way we generate, present and legitimise knowledge” (Rieder & Rohle, 2017) in methods-making and analysing image collections. Consequently, this project seeks to map the vision APIs outputs while comprehensively describing commercial vision AI forms of knowledge representation.
To achieve these goals, we employed multiple methods. First, we used statistical vision analysis to see how the models are semantically different and used a pre-trained word embedding model to analyze such differences. Second, by network vision analysis, we employed a more qualitative approach to the semantic space analysis. Thirdly, temporal vision analysis explored the question of changes in labelling from 2018 to 2022. For such research methods, three datasets of images were constructed.
2. Research Questions
Ontological semantic spaces I Statistical Vision Analysis
RQ1: How semantically similar or different are the examined APIs?
SUB-RQ1 (methodological): Would an implementation of a pre-trained word embedding model, such as GloVe, be beneficial for the study of the semantic differences of commercial image recognition systems?
Hypothesis: Cosine similarity could work as a metric for comparing the semantic differences quantitatively
SUB-RQ1-2: (quali/quanti): Are there significant differences in the relations between vector representations describing the semantic similarity of the image labels between different computer vision systems?
Hypothesis: There will be some differences between different services, as “they see the world differently”.
Ontological semantic spaces I Network Vision Analysis
RQ2: What are the taxonomies and layers of characterisation of the examined APIs?
SUB-RQ2: What are cross vision-APIs layers of characterisation towards stock images of women and men’s headshot pictures?
Interrogating Google Vision results over time I Temporal Vision Analysis
RQ3: Do Google Vision’s results change over time what exchange, to what extent?
SUB-RQ3: Has Google Vision improved its models over time? For example, has it become “more confident” in its outputs?
SUB-RQ3-1: Were there insertions or removal of labels?
3. Datasets
This project uses datasheets to document and manage access to image folders, computer vision outputs, and exploratory data visualization. Four image folders were used as an entry point to invoke multiple vision APIs (as specified in the research visual protocol) that rely on proprietary machine learning models to classify images.
Image folders:
-
Femboy: 12,542 Instagram images based on the hashtag #femboy were retrieved using the Visual Tagnet Explorer in February 2018.
-
Microcephaly, Zika Virus: 10,797 (or 9,930, cleaned dataset) Instagram images based on the hashtag #microcephaly were retrieved using the Visual Tagnet Explorer, developed by Bernhard Rieder, between June 2012 and October 2017.
-
Brazilian Presidential Candidates: 1,903 images based on the keyword "eleições" were collected from Folha de São Paulo using the Hexomatic tool between May 1st, 2022 and October 30th, 2022. Dataset building.
-
Women and Men Headshot Pictures from Getty Images: A dataset of 1,174 headshot pictures of women and men were collected from Getty Images with the Faktum batch download plugin on December 17th, 2022. See the dataset distribution.
4. Methodology
The project develops three methodological approaches for understanding computer vision through the outputs of four commercial vision APIs (Amazon, Clarifai, Google and Microsoft). Statistical Vision Analysis (1) to measure the similarities and differences between computer vision services with GloVe (Stanford, 2015) and Cosine Similarity (Mikolov et al., 2013). Temporal Vision Analysis (2) to verify whether Google Vision API improved its models over time. Network Vision Analysis (3) to map and understand cross-vision APIs topicality ordering by (a) describing different network zones (centre, mid-zone and periphery) and (b) visualising network clusters with data exploratory visualisations. Multiple image collections are analysed to describe AI forms of knowledge comprehensively.
For statistical vision analysis, we made a “proof of concept” that word embedding methods, such as GloVe, can measure the semantic similarities between the output labels of different commercial image recognition services. This is especially helpful methodologically because it can also reveal the semantic differences in how computer vision systems interpret and structure their conceptual ontological spaces. The network vision analysis builds upon and extends previous research in the field (see Mintz et al. 2019; Omena et al. 2021). Specifically, we incorporate a computer vision network methodology introduced by Omena (2021) to inform our analytical procedures. Furthermore, we conducted a more exploratory level of analysis for the temporal vision by building a simple tool to detect changes over time in Google Vision outputs. Three points in time are compared using the Femboy image dataset: Google Vision outputs from 2018, 2021 and 2022). Although the tool outputs provide four comparative elements (label insertions, deletions, also position and score changes), in this project, we closely analyse two: label insertions and deletions over time.
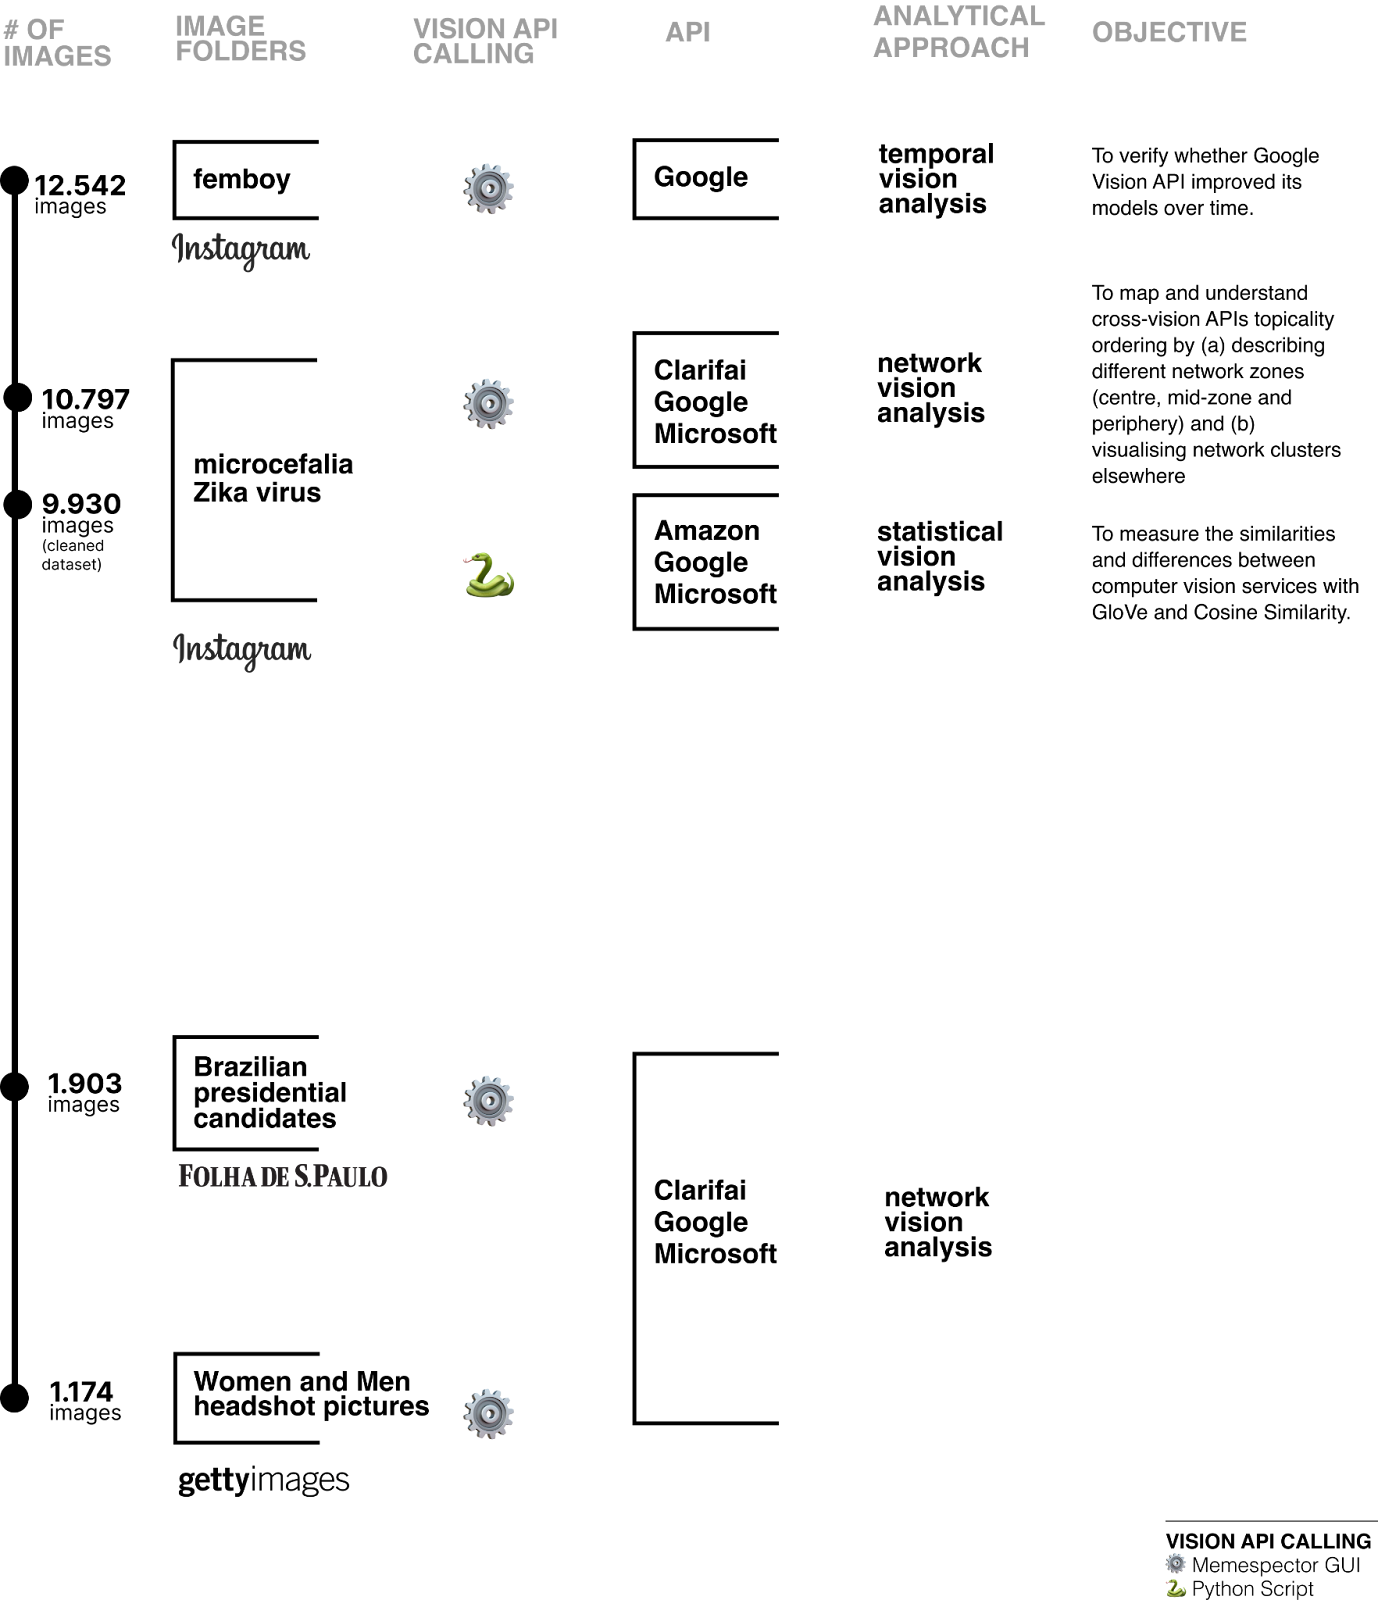 Figure 2. Project research visual protocol.
4.1 Statistical Vision Analysis
The data analyzed consist of the image-recognition systems' labels for each image. Three image-recognition services were used in the form available for public and academic use: Google Vision AI, Azure, and AWS. These services differ in the number of tags generated.
To account for semantic similarity, we adopted NLP-based techniques with proven utility for measuring similarity between words. Namely, word embeddings offered a tool for evaluating whether two given labels are used in typically similar contexts. These apply vector representations of words based on what surrounds their use (Turian, 2010; Huan, Socher et.al, 2012). For instance, the vector representations of a “road” and a “lane” would be similar in our case and clustered more closely in the conceptual semantic vector space than the representations of a “road” and a “bus”, which would be wider apart in that space since they are far less similar.
For this step, we programmatically removed compound words from the labeled dataset, because vector representations for words cannot accommodate multi-word constructs. This operation also addressed our observation that some of the data compounds encompass descriptive attributes; compounds of this sort (such as “central park”, ”metropolitan area”, and ”tall building'”) lack well-defined vector representations. In consequence, app. 15% of the initial labels were removed.
There are several ways to produce vector representations for words, with two well-regarded pre-existing models for this being Word2Vec, from Google (Mikolov, 2013), and Stanford University's GloVe (Pennington, 2014). Created on the basis of different texts, they may yield different results, especially when applied to image labels instead of human-produced text, the kind of material used in their training.
For this explorative study, we choose the GloVe model trained with Gensim data (glove-wiki-gigaword-100), involving 400,000 vectors, from a Wikipedia and Gigaword combined corpus.
Each label was expressed in vector form, and we measured the similarity between two vectors by computing the cosine similarity in the vector space. This is the standard way of evaluating the distance between word vectors in high-dimensional vector spaces (see e.g. Rahutomo, 2012).
4.2 Temporal Vision Analysis
An in-depth temporal analysis of the results obtained from utilising the Google Vision API was performed by constructing a comprehensive dataset of 12542 images. These images were labelled with the API during 2018, 2021, and 2022. The analysis uncovered a fluctuation in the number of distinct labels in the dataset, with 1739 unique labels being identified in 2018, 1213 in 2021, and 1282 in 2022. Despite the fluctuation, there was a consistent increase in the overall number of labels, rising from 189,847 in 2018 to 124,851 in 2021 and 125,255 in 2022. To determine the prominence of each label, the absolute frequency of appearances was weighed based on the confidence score assigned by the API. For example, if the label "person" appears four times with respective confidence scores of 0.5, 0.2, 0.35, and 0.02, the total number of appearances would be 1.07 (0.5 + 0.2 + 0.35 + 0.02). This calculation method was favoured over a simple absolute count of occurrences, as it allowed for filtering tags that appeared frequently but with low confidence scores.
4.3 Network Vision Analysis
For Network Vision Analysis, two approaches were selected. First, we used bigger datasets on 1. Zika virus and 2. Bolsonaro and Lula and used various visualization methods to get a better understanding of their respective semantic spaces (see the step by step). Second, we aimed to use the smallest dataset of men's and women's headshot images for a more in-depth view and closer analysis of Gephi outputs.
As part of the first approach, we used Memespector GUI (Chao, 2021) to extract labels and related data from Google Vision, Microsoft Azure, and Clarifai APIs. Next, for each API, we used Table2Net (MediaLab Tools) to make a network out of Lula & Bolsonaro and Zika virus datasets. We then used Gephi (Bastian et al., 2009) to build visualizations of these networks, using ForceAtlas2 (Jacomy et al, 2014) layout setting and running the modularity algorithm. We then used RAWGraphs (Mauri et al, 2017) to create Circlepack visualization, which groups terms based on co-occurrence, and sizes them based on the frequency of use. This visually displays dense nodes of related vocabulary, helping show each API’s frequently used and associated lexicon.
We performed a qualitative analysis of complete Circlepacks individually and then compared these results between API’s. We then matched clusters between datasets according to similar themes and language and compared semantic spaces. We also performed a quantitative analysis of unique tags and total tags each API generated per dataset and average confidence scores per dataset. Finally, we built ego networks from labels identified by all the APIs in the Zika Dataset (label Love) and Lula/Bolsonaro dataset (label Tie).
As part of the second approach, visualizations of the network of labels for the men and women dataset were prepared. After loading them onto Gephi, we were presented with a view of the labels, each represented by a node, with size signifying their number of occurrences and position in the network signifying their skewing towards either of the described phenomena.
In the case of the dataset of men and women headshot images, the position of the nodes represents labels to be exclusive, pruning towards, or being impartial between men and women. After initially observing the presented networks, we began to access them qualitatively, dividing the analysis by regions of the networks. Within those, we focused on the overall amount of labels, the most occurring ones, and categorization by the phenomena they describe. After that, we attempted to further profile the networks by describing their objectivity or subjectivity.
Using the Offline Image Query tool (Chao, Omena, 2021) and the original datasets of labels and images, we generated label-annotated images for them to be searchable. Upon selecting characteristic labels of each API, we qualitatively assessed images related to those labels and searched for examples of significant label patterns in each API. In the end, we exported the individual images.
5. Findings
5.1 Statistical Vision Analysis
Our findings suggest that the image-labelling services differ markedly from each other in their evaluation of image content (See figure 3, bottom row). Also, it appears that, overall, the labels provided by Amazon Web Services (AWS) are not similar to those supplied by the other two services. However, while Microsoft Azure and AWS show greater agreement, we still observed with GloVe that some partitions lie below the cutoff points, indicating poor agreement.
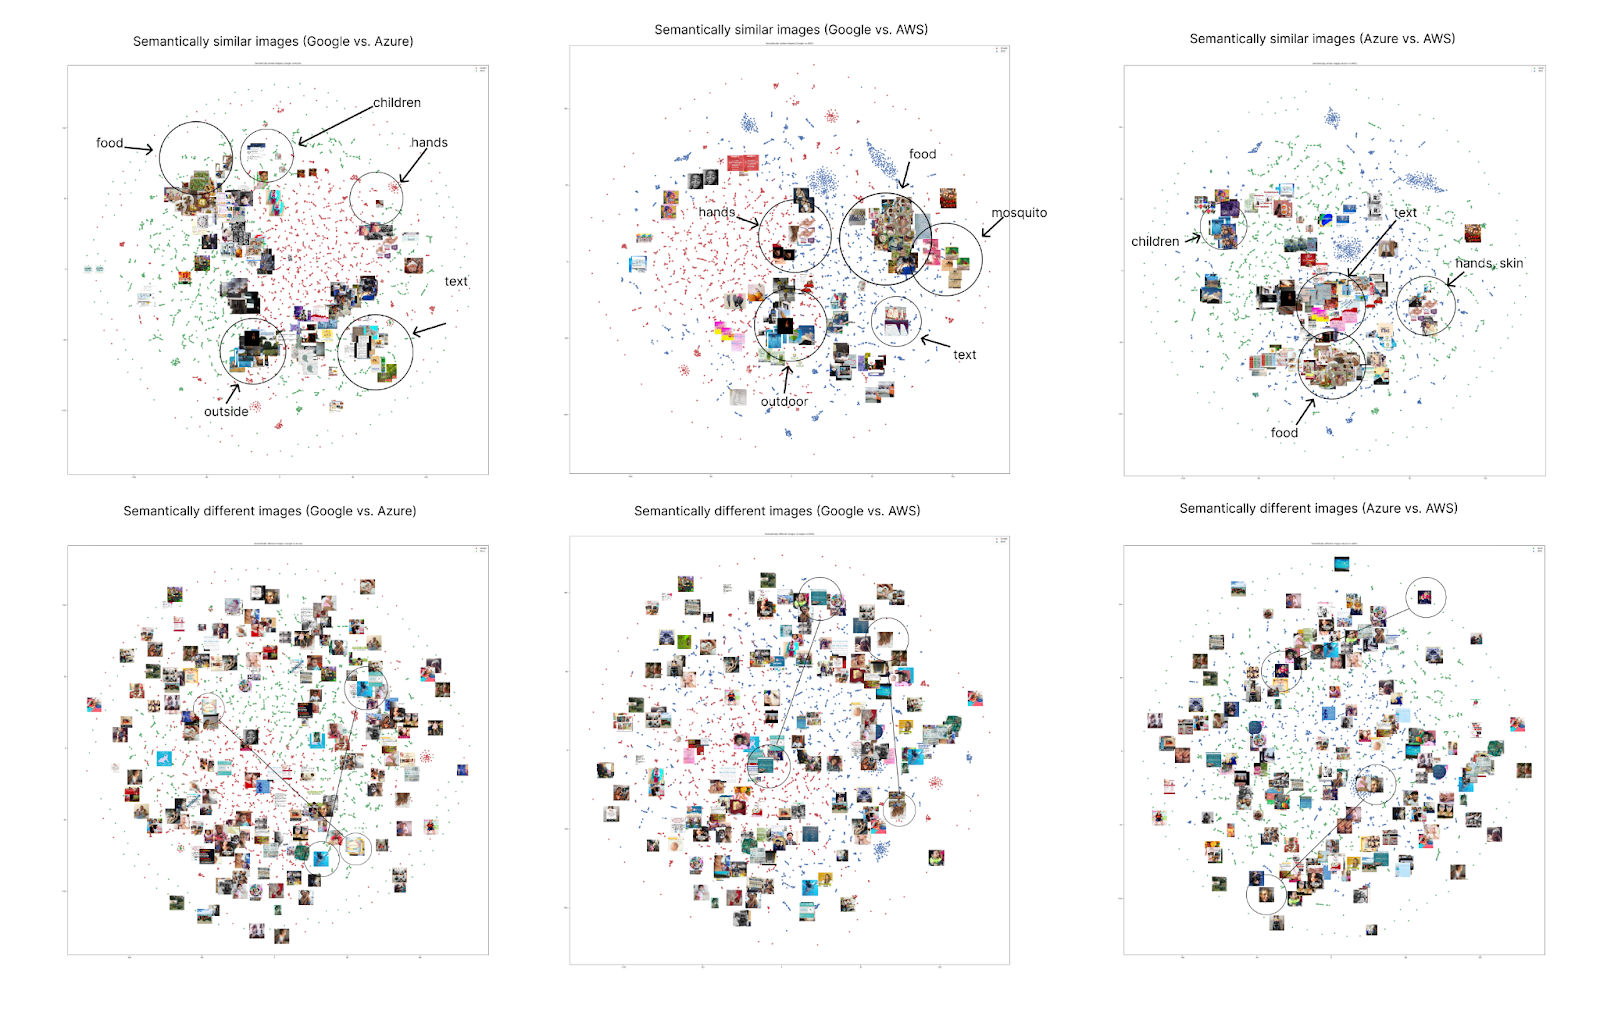
*Figure 3.* Top row: showing similarities between the way computer vision systems cluster images based on semantic similarity. When similar images overlap, the systems agree on what they see. Bottom row: showing that there are still many images, although the same, that the systems semantically disagree and are thus spread in the semantic space.
5.2 Temporal Vision Analysis
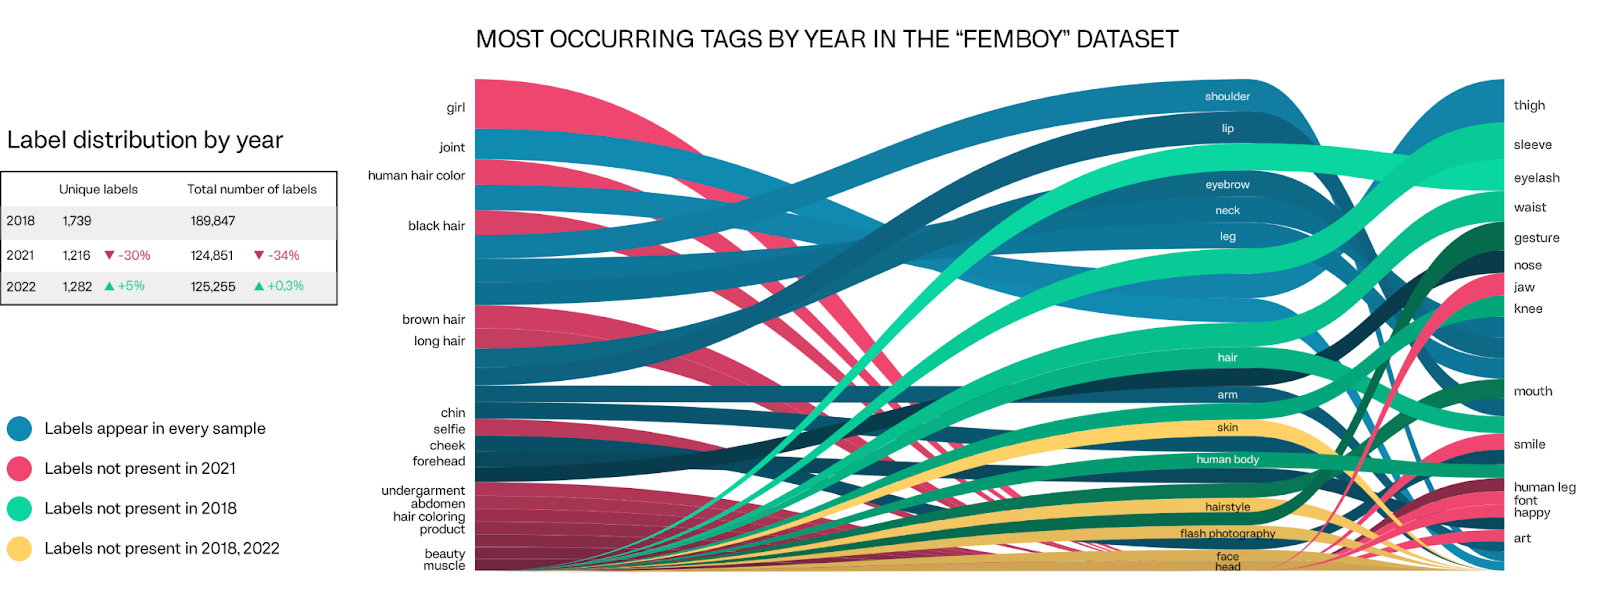 Figure 4. Temporal vision analysis of Google Vision API, Femboy image dataset. Label insertion and deletion over time. Computer vision outputs: 2018, 2021 and 2022.
The analysis revealed that in 2018, the most prominent label was "girl," with a salience score of 5917.27. In contrast, in 2021, the most prominent label was "shoulder," with a salience score of 3806.55, and in 2022, the label "thigh" held the highest salience score at 4658.26.
It is worth mentioning that during 2018 and 2021, the most prominently scored labels were identified as various body parts, including the shoulder, lip, eyebrow, neck, and leg. This observation signifies that these body parts play a crucial role in determining the relevance of an image concerning a specific label. This analysis emphasises the versatile nature of image recognition technology and implies the necessity for continual monitoring and upgrading of image recognition systems to ensure their accuracy and pertinence in an ever-evolving landscape.
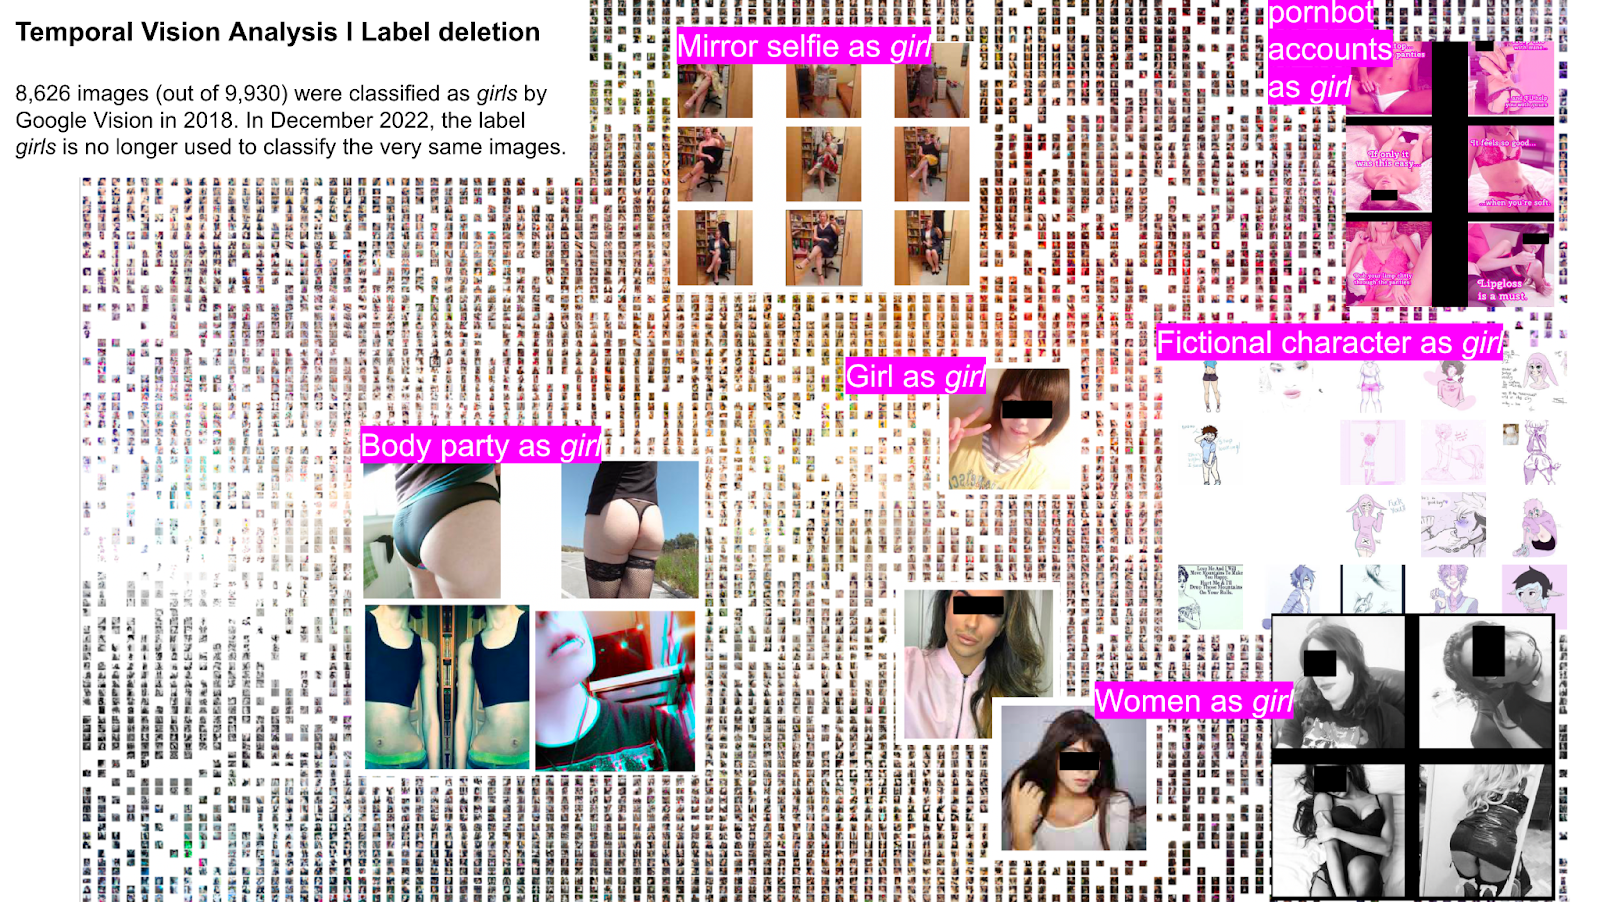
When closing reading the images labelled as girls in 2018, we identified a total of 8,626 images. Figure 5 shows examples of image typologies classified as girl in 2018. Three years after that, in 2021, the label girl was excluded from the outputs of Google Vision, and it will not return in 2022 (for classifying the same image collection). These results show an “improvement” in the performance of image classification, which no longer confuses fictional characters, body parties or women as girls. However, it also reveals a lack of updates concerning gender specificity. Instead, we find the predominance of labels such as human body, gesture, and happy. Google vision label detection methods are not yet trained to classify images of transgender, non-binary, or gender non-conforming. Further research and methods are required to contextualise the list of labels no longer classifying this image collection.
5.3 Network Vision Analysis

When comparing the Computer Vision APIs, Google uses few labels to describe images, while Clarifai uses the most. However, Google is more often correct. This illustrates that the number of unique labels does not necessarily correlate to API accuracy. Indeed, Clarifai is often incorrect.
Google uses the most precise and specific language — this shows in the number of clusters from the Circle Pack visualization. More clusters indicate more specific connections between labels.
Based on the labels that the APIs employ, Microsoft uses more generic language, reflecting the reduced number of clusters within its Circle Pack. Since Microsoft’s labels are more generic, they are often used to describe multiple different images. Google uses a more precise and concise vocabulary, going beyond generic words while trying to describe images and identify their context.
Through the largest number of unique labels, Clarifai often employs adjectives and abstract concepts to describe beyond what is in the image. This results in the API often being incorrect. We attribute the difficulties we experienced in identifying similar clusters to the discrepancies and differences between the APIs’ vocabulary.
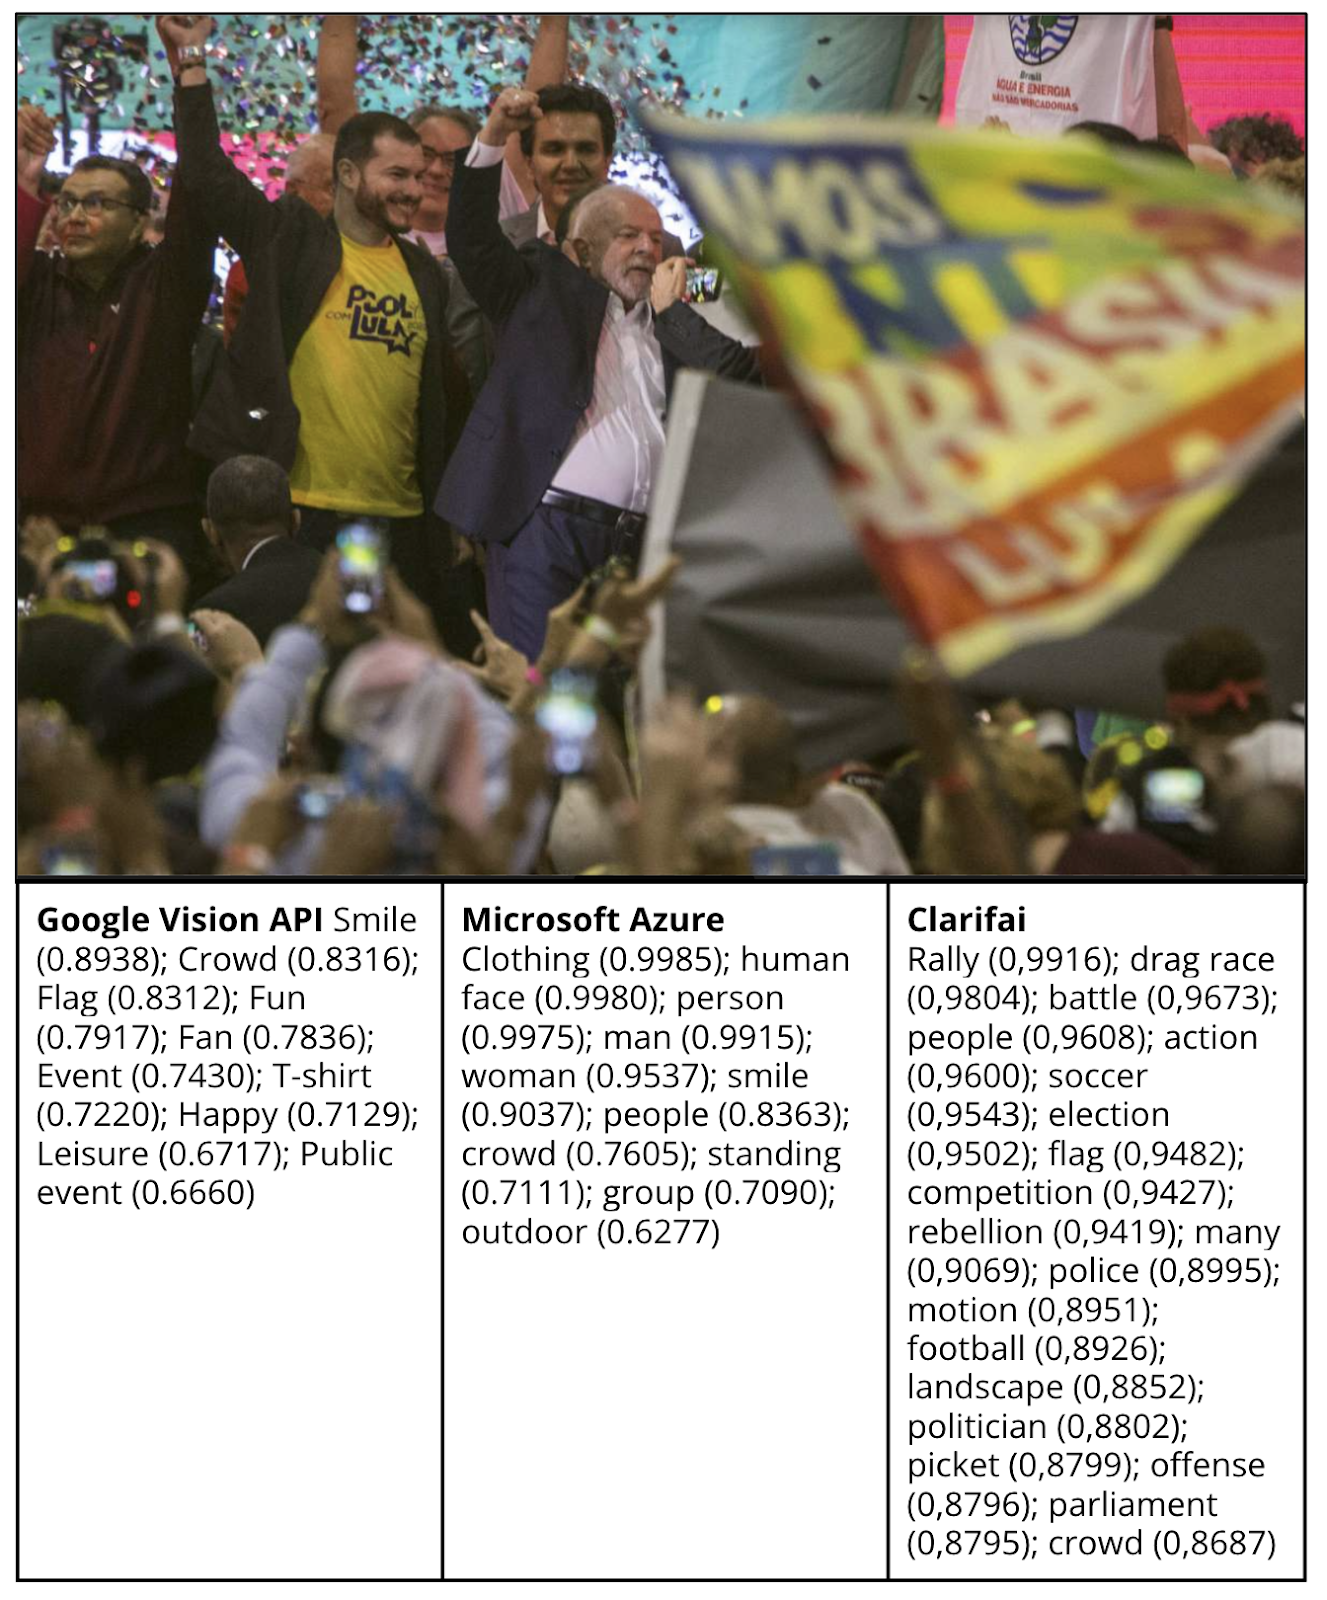
Table 1. Image from the Brazilian Presidential Candidates dataset and image classification results according to each of the APIs.
When analyzing the same image across APIs (Table 1), we observed that, through conservative language, Microsoft usually remains descriptive and “safe”. Consistently, Google suggests more specific terms. Clarifai attempts to identify themes that are not immediately identifiable in the image but could be inferred through real-world contextualisation. Again, this often results in inconsistencies.
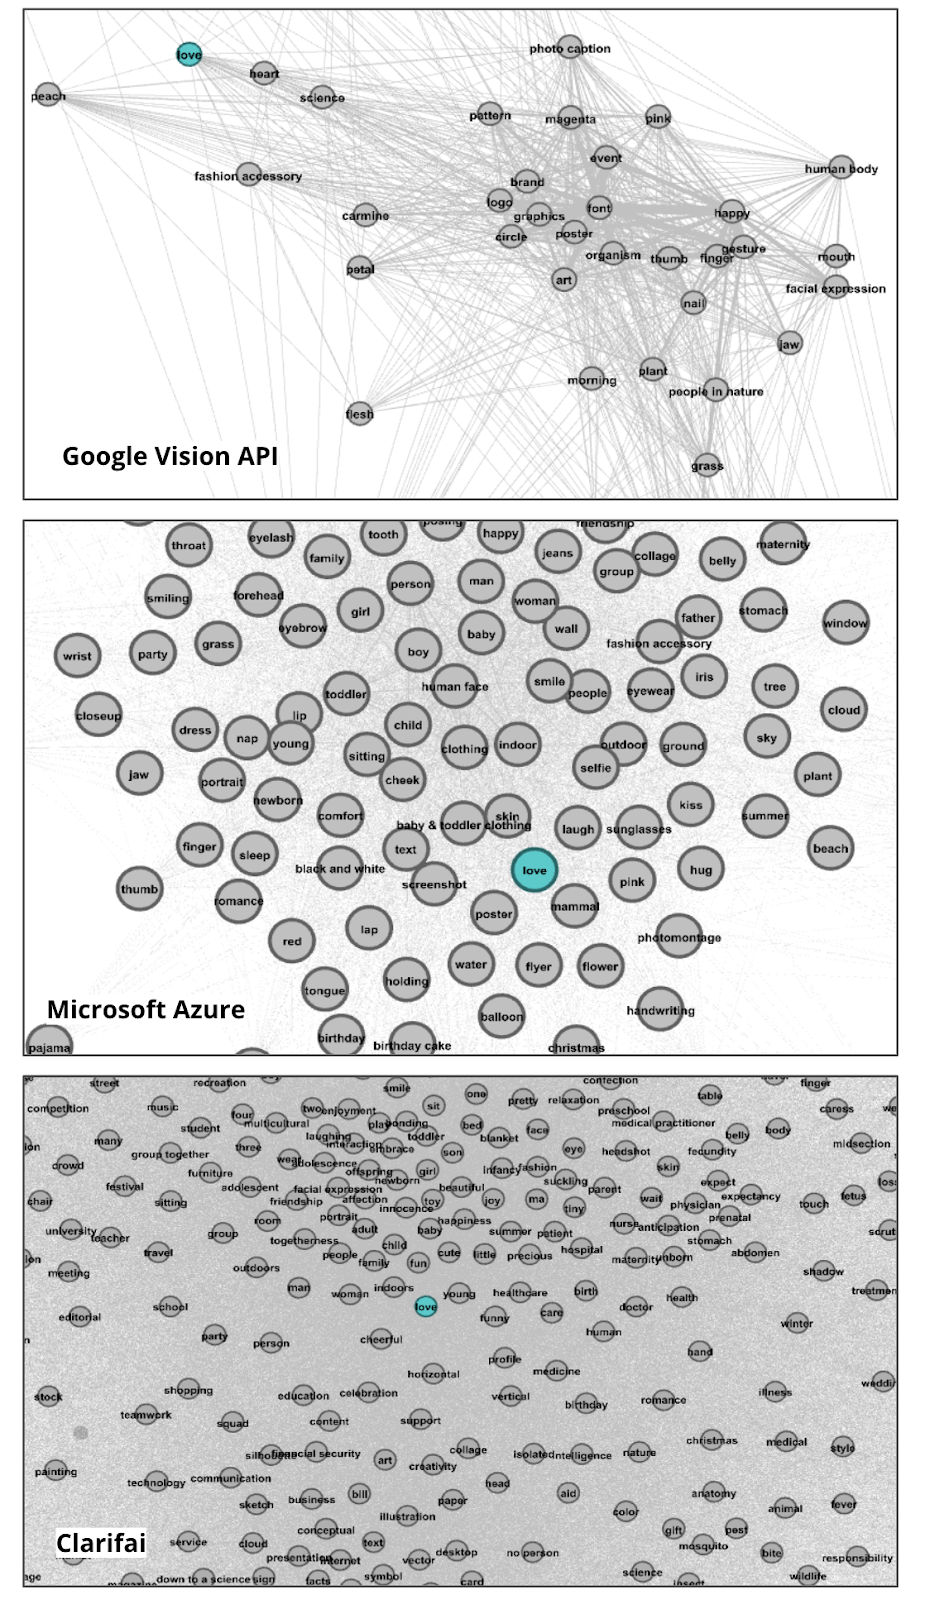
Our findings are further supported by the construction of ego networks. While Google presents more precise networks with densely connected labels, Microsoft’s networks are more sparse, and Clarifai presents chaotic and extended ego networks.
Clarifai
Clarifai API network presents the least shared labels for men and women among the three APIs analyzed. Therefore, it does not contemplate the variety of gender spectrum. That said, we found descriptive labels in common in the centre of the network, as well as unbalanced, archetypical roles and adjectives assigned to Women and Men peripheries.
The centre of the network features a few abstract labels involving concepts and emotions such as “freedom”, “art”, “alone”, and “happiness”; labels for background information such as “house”, “frost”, “temple”, “dark” and “sun”. In terms of the periphery, women’s labels are more related to a pleasing physical appearance, and men's more positive tags are related to professional life.

Looking in detail at labels related to hair clothing, both men and women have few descriptive labels, instead of many subjective and contradictory tags: 98 pictures of women are tagged as “man”, and 76 pictures of men have the label “woman”. Also, 205 pictures on the Women dataset are labelled as “adolescent”, but the vast majority show women arguably over 30 years old.
Google Vision API
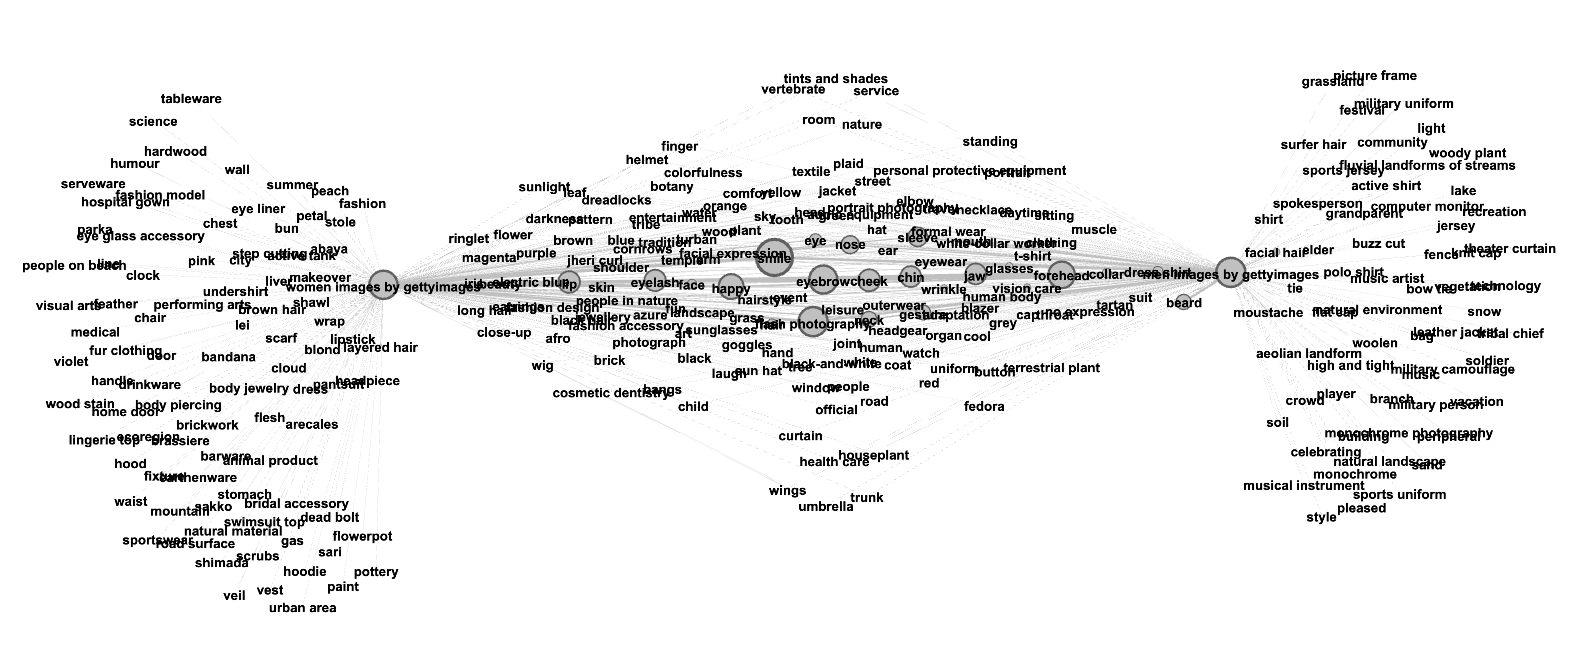
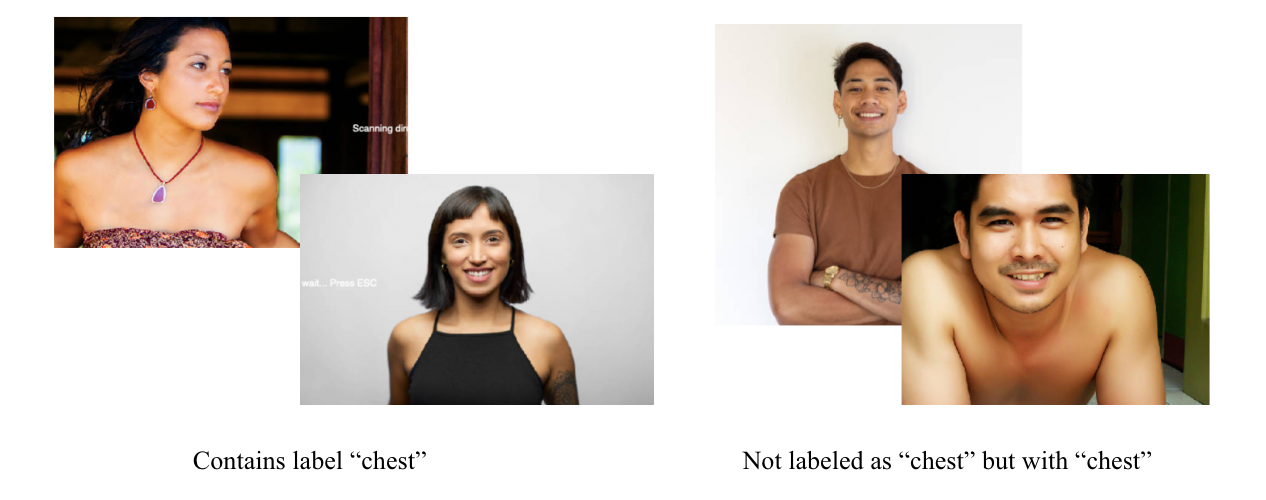
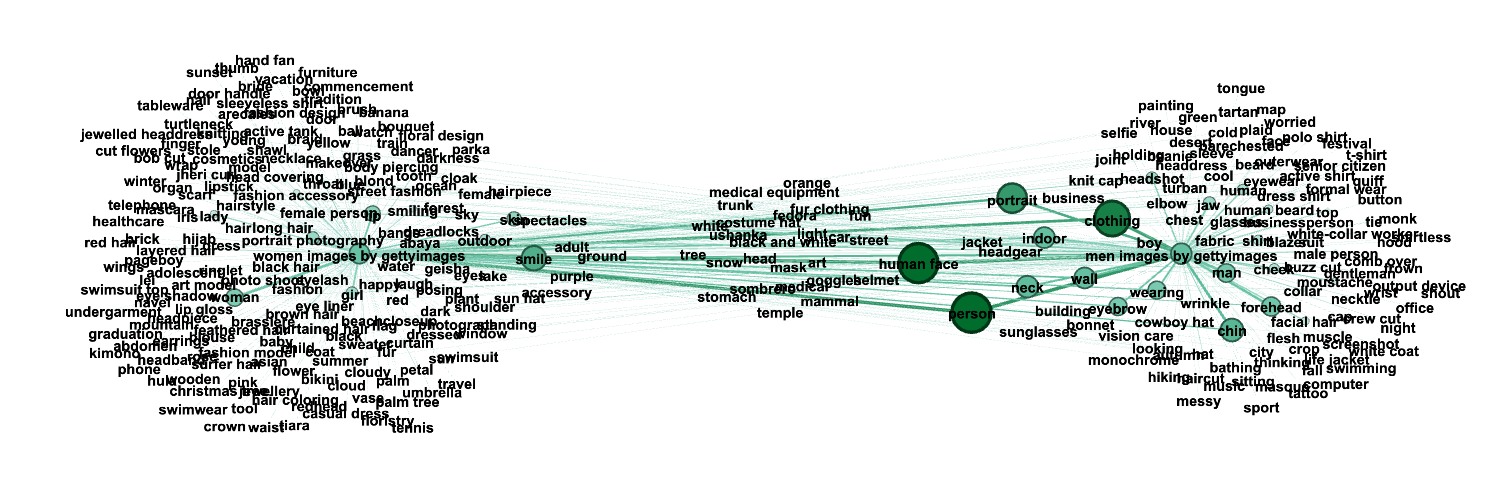
Compared with Clarifai, Google has the most shared labels for men and women, as can be observed in Figure 10, more specifically in the centre of the network. The such area of the network contains mainly objective and descriptive taxonomy to label facial body parts such as “nose”, “eyebrow”, “cheek” etc. However, other labelled body parts at the midterm and periphery part of the network reveal that the scope of the labelled parts varies depending on gender: Google Vision only labels other body parts in addition to facial parts such as “chest” and “waist” when it comes to women (Figure 11).
In the area of women (network mid-zone), there are some abstract labels such as “entertainment”, “fun” and “beauty”, color labels including “brown”, ”purple”, “magenta” and “blue”, and object labels relating to accessories such as “earrings”, “jewelry”, “wig” and “flower”. For men, the midterm area contains abstract labels like “cool”, clothing such as “dress shirt”, “t-shirt” and “suit”, and accessories such as “glasses”, “necklace”, and “cap”.
A further analysis on the periphery of the network indicates that Google makes subjective inferences such as occupation and context. Labels of more diverse occupations such as “spokesperson” and “music artist” are assigned mainly to men; while women have only one label of occupation: “fashion model”, and more fashion-related or art-related terms such as “fashion” and “performing arts”. In addition, although both men and women have labels related to clothing, women appear to be more related to cloth that reveals more skin, such as “swimsuit top” and “lingerie” and "make-up".
Microsoft Azure
In the case of women and men headshot dataset, network visualization by Microsoft Azure API is characterized by a sparse center of the graph, mostly constructed of infrequent objective labels and taxonomy for different objects like types of headwear (“sombrero”, “fedora”, “fur clothing”, “ushanka”, “googles”, “helmet”, “mask”, “costume hat”), generic body features like “stomach” or “head”. Several colours like black and white, white, and orange also appear, accompanying descriptions of surroundings, such as “snow”, “light”, “car”, “street”, “tree”, “trunk”, and “temple”. Only abstract concepts in the centre are “fun” and “art”.
Slightly more correlated to the women (network mid-zone) are emotional labels like “smile”, and “smiling”, but also “young”. On the other hand, “senior citizen” is in the region of men periphery. Importantly, generic labels like “person, human face, portrait” (hence objects that all the pictures include) accompany more men images than women. “Clothing” label is also largely skewed towards men, while “skin” is towards women. Overall though, there are not many emotional, subjective labels.
Interestingly, some labels of clothes are rather impartial, while some only attributed to either gender. For example, the label “fedora” is present in descriptions of both men and women. “Tie” on the other hand, is only attributed to men, despite the fact that tie is clearly present in one of the women's pictures as well. In this case, the Microsoft API only labels the picture with “shirt”.
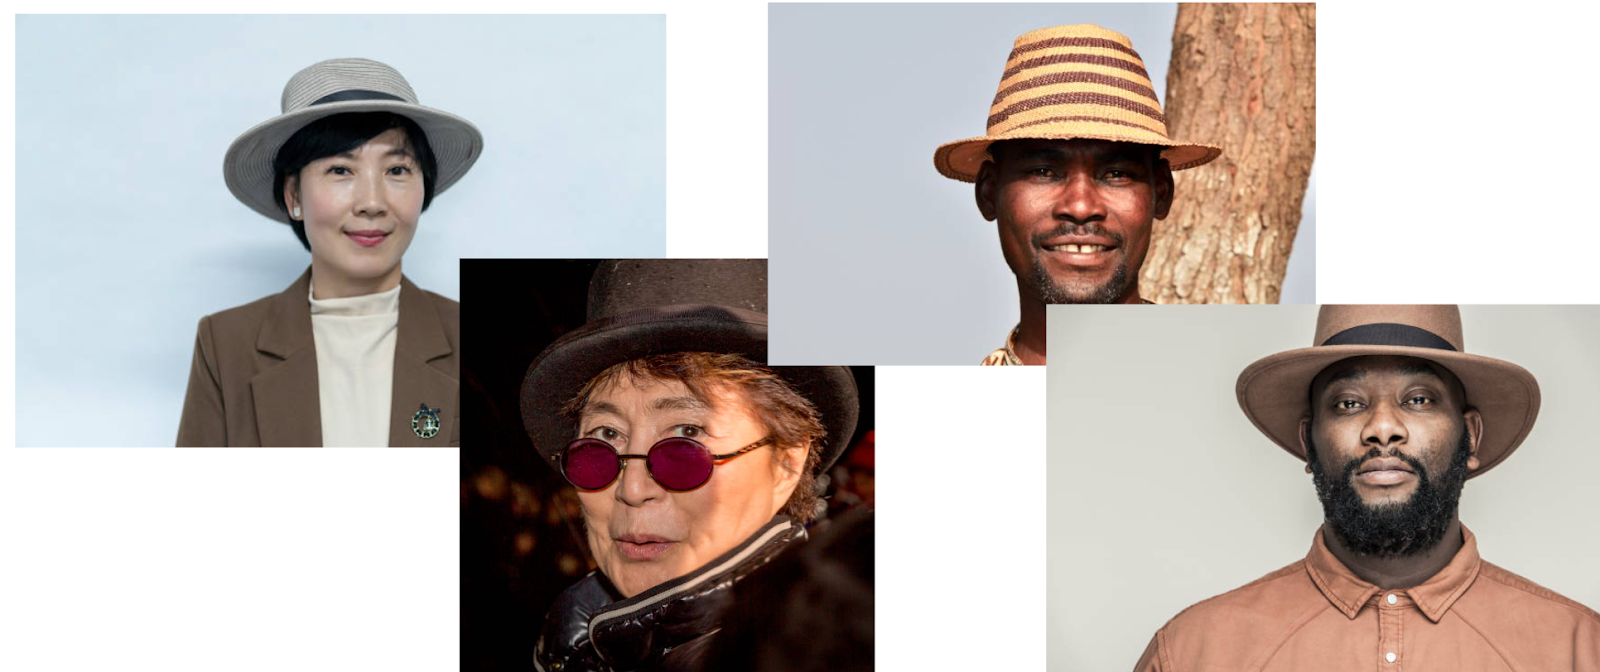 Figure 13. Images attributed with the label “fedora” by Microsoft Azure API.

In total, Microsoft seems to play the card of balance between men and women instead of impartiality. This shows 1. in the sparse centre, 2. in the equal distribution of facial and body features, 3. distribution of hairstyles (very wide vocabulary), and 4. distribution of labels of surroundings. Also, the labels male person and female person have the exact same number of occurrences (115) in the dataset. Regarding occupations, the label white-collar worker and business person is located in the men's periphery, whereas the model and art model is in the region of women's periphery.
6. Discussion
Statistical vision analysis
The main observation from our various analyses is that image-recognition services are not mutually consistent in the view emerging from what they see. There are significant differences both in the number of labels for each image and, more importantly, in the semantic and conceptual understanding of what the image represents.
It appears that the Azure--AWS and Azure--Google labels come closer to agreement than other service pairs do, but even here our findings indicate that there is no clear semantic agreement on the labels. Future research should try to test if the differences are rooted in image content. There was no time to address this with the given timeframe of the winter school course.
Given our findings, there seems to be merit to the calls for caution in putting pre-existing image-labeling services to scholarly use (Webb-Williams, 2020).
Bluntly characterized, the main commercial services largely disagree on what a specific image contains. It may indeed be worthwhile, then, to focus on manually annotating images on the basis of one's research question -- for instance, counting the number of trees (see e.g. Oliveira, 2022).
Nonetheless, we argue that social scientists ought to balance cautiousness against the potential benefits of using preexisting labeling services. Firstly, building a custom classifier brings problems of its own. It is laborious and requires standardization that is seldom possible with more exploratory work. When the classifiers cannot easily adapt to more exploratory image analysis, without predefined categories, the ``roll your own'' process becomes an obstacle to open-ended, fluid, and dynamic exploration of visual material. Restricting one's tools in such research settings limits a large amount of scholarly work on qualitative analysis of visual material. Nor is there any guarantee that the custom tools will eliminate all possible problems in any case.
Secondly, few people possess the rather extensive technical expertise to build an image classifier from scratch, whereas easy-to-access and relatively inexpensive image-recognition services may democratize image-analysis-based approaches.
Instead of arguing that image-labeling systems' scholarly application is best avoided, we ask how scholars can use these services in a responsible, reflexive manner that accounts for the poor cross-service label agreement.
Temporal vision analysis
We identified a significant shift in the labelling approach used by Google's image classification system over time. In its early years, Google relied on general labels such as "girl" and "human hair color," gradually transitioning to more specialised and detailed labels like "shoulder," "lip," and "eyebrow," among others. This evolution could be attributed to improving Google's image recognition methodology. Specifically, the system no longer included the label "girl" in the outputs, and we did not see it when we re-approached the database in 2022. This improvement decreased confusion between fictional characters, body parts, and women and girls.
These findings coincide with Google's 2021 announcement about the MUM (Multi-Task Unified Model) model in the testing phase. MUM is an advanced natural language processing technology that enhances Google's image comprehension capabilities. Unlike the usual Google Vision API, which identifies objects in an image and associates them with predefined labels, MUM can comprehend the image's context and make inferences based on the interpretation of labels and their combination. For example, consider a picture of a woman holding a stylish hat. The traditional Vision API model may identify objects in the image, such as a hat, a woman, lips, a shoulder, and a hand. However, the MUM model can comprehend the image's context and interpret the combination of labels to understand that it shows a model posing for a fashion magazine photo shoot.
To make more contextualised inferences about images, MUM needs a computer vision model to provide more detailed object labels. The more specific the identification of objects, the greater the possibility of establishing contextual interpretations based on label relationships. While Google has not publicly announced the commercial implementation of MUM, our observation of the shift from general to specific labels may indicate a methodological repositioning in constructing image representation categories, emphasising granularity for context inference. We hypothesise that the wider use of more granular image tags - such as specific body part labels instead of more generic ones like "human body" - may be related to a shift in Google's methodology under the hood.
Finally, our analysis revealed a general lack of specificity concerning gender in the image recognition process. Labels like "human body," "gesture," and "happy" are the most predominant for pictures associated with transgender, non-binary, or gender non-conforming individuals. This trend is worrisome and may indicate that vision AI technology keeps reproducing the social invisibilities and asymmetries regarding these people. Due to the labelling approach used by Google, generating more complex labels may necessitate greater access to training databases that observe the specificities and sensible particularities that best represent transgender, non-binary, or gender non-conforming individuals' imagery. These observations indicate that methodological limitations and the perpetuation of stereotypes due to inadvertent generalisation are issues that require further analysis.
Network vision analysis
Beyond assisting a descriptive task to profile the modes of labelling of cross vision-APIs, network vision analysis showed efficiency in quickly identifying the misclassification errors of AI outputs. There are several reasons for this, from partial data to a lack of diversity in the training dataset. However, suppose we insist on experimenting or taking methodological advantage of machine learning models for image classification. In that case, we should accept that these models are known for making mistakes and not offering perfect results. Second, cross vision-APIs offer different taxonomies reflecting proper ways of seeing. Therefore, and in this understanding, we should consider computer vision limitations and particular taxonomies when using their output for research purposes. Extra analytical efforts are involved and required for these methods.
7. Conclusions
This research found that the three popular vision APIs - Google, Microsoft Azure, and Clarifai - have unique methodologies that result in distinct digital ontologies and worldviews. Google AI values detail and accuracy, making it ideal for tasks that require high precision, like recognising objects and their attributes. Microsoft Azure, on the other hand, focuses on generic labels and a narrow context, resulting in descriptions lacking context and using basic language. Clarifai takes a more conceptual approach, attempting to understand the real-world context of images, but often fails due to its inability to deal with complex labels.
Although all three APIs serve the purpose of image labelling, they have different perspectives. These varying objectives, methods, classification protocols, and evaluations of images lead to different digital ontologies and representation methodologies. These differences result in non-compatible label vocabularies and proprietary methods for evaluating the credibility and reliability of results.
The diverse logical paths used by each API make it difficult to study computer vision models using a single methodology that fails to recognise each model's unique perspective. Hence, further methods for studying vision APIs should focus on positions that leverage the differences between models, and use these differences as a resource to understand the role of AI in shaping the knowledge of imagery.
8. References
Bastian, M., Heymann, S., & Jacomy, M. (2009). Gephi: An Open Source Software for Exploring and Manipulating Networks. Third International AAAI Conference on Weblogs and Social Media, 361–362. https://doi.org/10.1136/qshc.2004.010033
Chao, T. H. J. (2021). Memespector GUI: Graphical User Interface Client for Computer Vision APIs (Version 0.2) [Software]. Available from https://github.com/jason-chao/memespector-gui.
Chao, T. H. J. & Omena, J. J. (2021). Offline Image Query and Extraction Tool (Version 0.1) [Software]. Available from https://github.com/jason-chao/offline-image-query.
Cripps, Paul (2022). A phenomenological, observational approach to semantic knowledge graphs. 5th Meet-up Knowledge Graphs Interest Group at the Alan Turing Institute. Available from https://github.com/turing-knowledge-graphs/meet-ups/blob/main/agenda-5th-meetup.md
d'Andrea, C., & Mintz, A. (2019). Studying the Live Cross-Platform Circulation of Images With Computer Vision API: An Experiment Based on a Sports Media Event. International Journal Of Communication, 13, 21. Retrieved from https://ijoc.org/index.php/ijoc/article/view/10423/2627
Huang, E. H., Socher, R., Manning, C. D., & Ng, A. Y. (2012). Improving word representations via global context and multiple word prototypes. Proceedings of the 50th Annual Meeting of the Association for Computational Linguistics (Volume 1: Long Papers) (pp. 873-882).
Jacomy, M., Venturini, T., Heymann, S., Bastian, M. (2014). ForceAtlas 2, a continuous graph layout algorithm for handy network visualization designed for the Gephi software. PloS one, 9 (6), e98679. https://doi.org/10.1371/journal.pone.0098679
Mauri, M., Elli, T., Caviglia, G., Uboldi, G., & Azzi, M. (2017). RAWGraphs: A Visualisation Platform to Create Open Outputs. In Proceedings of the 12th Biannual Conference on Italian SIGCHI Chapter (p. 28:1–28:5). New York, NY, USA: ACM. https://doi.org/10.1145/3125571.3125585
Medialab Tools. Table2Net. [Software]. Available from https://medialab.github.io/table2net/
Mikolov, T., Sutskever, I., Chen, K., Corrado, G. S., & Dean, J. (2013). Distributed representations of words and phrases and their compositionality. Advances in neural information processing systems, 26.
Mintz, Silva et al. (2019). Interrogating Vision APIs. 2019 SMART Data Sprint. NOVA University Lisbon. https://metodosdigitais.fcsh.unl.pt/?page_id=1212
Oliveira, L. F. A. D., Pagano, A., & Moro, C. (2022). Challenges in Annotating a Treebank of Clinical Narratives in Brazilian Portuguese. International Conference on Computational Processing of the Portuguese Language (pp. 90-100). Springer, Cham.
Omena, J.J. (2021). A digital methodology for building and reading computer vision networks (second draft version). https://docs.google.com/document/d/e/2PACX-1vR8IZJKni6j1tG8KE872LS8HsqBVe-PKSIlqVG5mMAfR7vUKTzmW_T9TPSe7mA-GVwr0LwMS5I96dbq/pub
Omena et al. (2020). Cross-Platform Digital Networks. 2020 SMART Data Sprint. https://metodosdigitais.fcsh.unl.pt/?page_id=1824
Omena, J. J., Elena , P., Gobbo, B. ., & Jason , C. (2021). The Potentials of Google Vision API-based Networks to Study Natively Digital Images. Diseña, (19), Article.1. https://doi.org/10.7764/disena.19.Article.1
OuestWare, CNRS CIS & Venturini, T. Retina. [Software].
Pennington, J., Socher, R., & Manning, C. D. (2014). Glove: Global vectors for word representation. Proceedings of the 2014 conference on empirical methods in natural language processing (EMNLP) (pp. 1532-1543).
Rahutomo, F., Kitasuka, T., & Aritsugi, M. (2012). Semantic cosine similarity. The 7th international student conference on advanced science and technology ICAST (Vol. 4, No. 1, p. 1).
Ricci, D., Colombo, G., Meunier, A., & Brilli, A. (2017). Designing Digital Methods to monitor and inform Urban Policy. The case of Paris and its Urban Nature initiative. In: 3rd International Conference on Public Policy (ICPP3)-Panel T10P6 Session 1 Digital Methods for Public Policy. SGP, 2017. p. 1-37.
Rieder B and Rohle T (2017) Digital methods from challenges to Bildung. In: Schafer MT and van Es K(eds) Datafied Society. Amsterdam: University Press, pp.109–124.
Schwemmer, C., Knight, C., Bello-Pardo, E. D., Oklobdsija, S., Schoonvelde, M., & Lockhart, J. W. (2020). Diagnosing Gender Bias in Image Recognition Systems. Socius, 6, 2378023120967171. https://doi.org/10.1177/2378023120967171
Turian, J., Ratinov, L., Bengio, Y. (2010). Word representations: a simple and general method for semi-supervised learning. Proceedings of the 48th annual meeting of the association for computational linguistics (pp. 384-394).
Venturini, T., Jacomy, M., & Jensen, P. (2021). What do we see when we look at networks: Visual network analysis, relational ambiguity, and force-directed layouts. Big Data & Society, 8(1). https://doi.org/10.1177/20539517211018488
Williams, N. W., Casas, A., & Wilkerson, J. D. (2020). Images as data for social science research: An introduction to convolutional neural nets for image classification. Cambridge University Press.
Contributions
Janna Joceli Omena (JJO), Elias Bitencourt (EB), Jason Chao (JC), Ana Marta Flores (AMF), Rita Sepúlveda (RS), Luca Draisci (LD), Anton Berg (AB), Minh Ngo (MN), Eduardo Leite (EL), Lara Dal Molin (LDM), Jiri Svoboda (JS), Madeline Brennan (MB), Danielle Games Cruz (DGC), Lishan Qin (LQ) & Qingyue Du (QD).
Project concept, research design and methodological proposal: JJO
Image collections: JJO, EB, EL
Computer vision datasets: JJO, AB
Clarifai computer vision datasets: all participants collaborated with the creation of Clarifai API keys
Software making: JC and JJO
Statistical vision methods and analysis: AB and MN
Network vision analysis: AMF, RS, EL, LDM, LQ, JS, MB, DGC and QD
Temporal vision analysis: JJO, LD, JS, LQ and QD
Profiling cross-vision APIs outputs: all
Key findings: all
Discussion: AB, EB, JJO
Conclusion: EB
-- JannaJoceliOmena - 16 Jan 2023Ideas, requests, problems regarding Foswiki? Send feedback