|
|
You are here: Foswiki>MoM Web>DataVisualisation (22 Sep 2014, MaxKortlander)Edit Attach
Data Visualization
Data visualization employs the use of graphics to communicate or understand information. 1 General Information1.1 History
1.2 Theory
2 Fields of use
2.1 - News
2.2 - Environmental Studies
2.3 - Geographics
2.4 - Politics
2.5 - Other
3 Data visualization tools
3.1 - Visualization, Presentation and Publishing Tools
3.2 - Analysis, Graphic and Enterprise Tools
3.3 - Google's Charting and Visualization Tools
3.4 - Tools for Visual Programming of Languages and Environment
3.5 - Tools for Mapping
3.6 - Word- / Tagclouds
3.7 - Personal Tools
3.8 - Specialist Tools
3.9 - Collection of Tools
4 Data Visualization vs. Infographics
4.1 - Infographics
4.2 - "How- to"- Publications
4.3 - Javascript / Flash-Infographic Tools ......
General Information
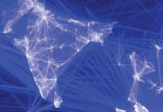
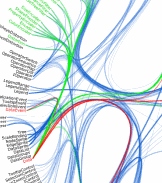
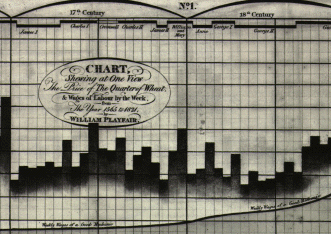
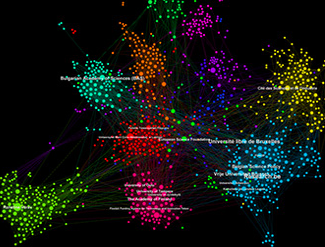
History Scholars differ on their consideration of data visualizations origins. Maps dating from 6200 BC mark the beginning for some (Friendly and Denis, 2005), while others place 2nd century astronomical charts at the onset of data visualization (Few, 2007). Generally, scholars agree that such early maps and charts set the basis for further developments in data visualization. As is the case with origin, there is no clear academic consensus as to the particular moments of major advancement in data visualization. In many respects, technological advancements coincide with innovation and prevalence of data visualization methods (Friendly, 2006).The Enlightenment saw the rise of visual representations of measurements and theories (Friendly and Denis, 2005). In the 19th century, infographics gained popularity in a variety of forms such as bar graphs and pie charts. Widespread computer use from the 1970s onward marks the most recent fundamental shift in data visualization. Digital methods make a variety of new trends possible. These include data manipulation, multidimensional visualization (Friendly and Denis, 2005), analytic visualization, data visualization in academics, and the development of high-functioning data visualization products (Few, 2007). Gallery of Data Visualization - Historical MilestonesThis gallery of Data Visualization displays some examples of the Best and Worst of Statistical Graphics, with the view that the contrast may be useful, inform current practice, and provide some pointers to both historical and current work. We go from what is arguably the best statistical graphic ever drawn, to the current record-holder for the worst. History infographics are especially effective in analyzing historical data. Timelines, graphs and charts assist you in better understanding the past.Networks
Theory
Data Visualization can be described as a practice which aims to communicate abstract data through the use of interactive visual interfaces (Manovich 2010). It is important to notice, that for data visualization there is not a substantive body of theory (Unwin 2008, 4), and that it is thus dependant on different disciplines. Deriving from statistics and aiming at developing a (visual) language for successful communication and interpretation of visual information, data visualization as well takes perceptual psychology and cognitive science into account.Yet, as Purchase et al. claim, those disciplines fail to address the specific problems of visualization. While they provide general guidelines, models from non-visualization fields do not consider the context of the visualization environment the user and the computer. What is needed is a set of formal foundations that bridges the gap between the general human experience and the visualization domain ( Purchase et al. 2008, 52). Consequently, theories of data visualization comprise formal models (ibid., 65), that have to be applied to varying contexts.
As Unwin claims there are two main reasons for using graphic displays of datasets: either to present or to explore data (Unwin 2008, 59). In contrast to static printed visualizations, data visualization is a dynamic medium of complex relationships (Purchase et al. 2008, 52). Hence a theoretical understanding and analysis has to be based on a processual, temporal method (ibid.).
Fields of Use
News
 Collection Interactive News Graphics
A (growing) collection of interactive news graphics produced by the Guardian and the New York Times. Gregor Aisch driven by data
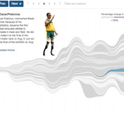
This work combines interactive information visualization, cartography and journalism. Data Visualization: Journalism's Voyage West
This visualization plots over 140,000 newspapers published over three centuries in the United States. Newspaper Map
Find and translate all newspapers in the world in this growing collection.
Environmental Studies
 Wood Dimensional Changes
This collection shows visual data like the variations in wood Moisture Content (MC) in a wide range of cities, according to the wood type, month of the year, temperatures and humidity. A useful instrument to woodworkers/companies to know when and how wood reacts to external conditions and thus apply prevention treatment to keep its quality. Visualizing the Environment
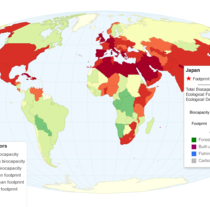
This visualization articulates the importance of understanding the world's use of renewable resources. Compare countries to the worldwide highest levels or just two countries against each other; change scale from per person to per nation; or select a specific kind of resource. Environment Infographics | Visual.ly
A dataviz collection on a wide range of topics. Creators and publishers include research institutes, freelancers, media and design companies, news organisations etc.
Geographics
 Explore Visualizations | visualizing.org
Geography Infographics | Visual.ly
Explore Visualizations | visualizing.org
Geography Infographics | Visual.lyFew topics are better suited than geography for examination as an infographic. These geography infographics span topic from tsunamis to cartography.
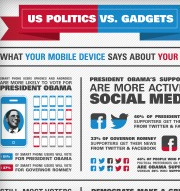
Politics
 Explore Visualizations | visualizing.org
Politics Infographics | Visual.ly
Explore Visualizations | visualizing.org
Politics Infographics | Visual.lyWith recent political turmoil and unrelenting bipartisanship, explore the political infographics showcased to stay up-to-date with worldwide politics.
Other
 Other Infographics | Visual.ly
The infographics you find here don't fit neatly into our other categories. Explore the hundreds in this list as you may just find a golden nugget! 50 Great Examples of Data Visualization | Webdesigner Depot
This are 50 of the best data visualizations and tools for creating your own visualizations out there, covering everything from Digg activity to network connectivity to whats currently happening on Twitter. 40 Useful and Creative Infographics
In this collection, youll find forty beautiful and educational infographics, displaying the uncommon spectacle of "art meets science". Explore Visualizations | visualizing.org
visualizing.org is a community of creative people making sense of complex issues through data and design...and a shared space and free resource to help you achieve this goal. Data visualization- Collections at OpenProcessing
OpenProcessing is an online community platform devoted to sharing and discussing Processing sketches in a collaborative, open-source environment. Visual representation of data : algorithms and methods. The Best Data Visualization Projects of 2013
The best data visualization projects of 2013. Tower Graphics-Data Visualization
Tower Graphics. Data Visualization. A touch of humor on the Behance Network. data visualizations resources
Data and visualization blogs worth following. information aesthetics - Data Visualization & Information Design
Inspired by Lev Manovich's definition of "information aesthetics", this weblog explores the symbiotic relationship between creative design and the field of information visualization. More specifically, it collects projects that represent data or information in original or intriguing ways.
Data visualization tools
Visualization, Presentation and Publishing Tools
 Gephi (Intermediate)
Gephi is an interactive visualization and exploration platform for all kinds of networks and complex systems, dynamic and hierarchical graphs. Many Eyes (Beginner)
Many Eyes is a set of free data visualization tools provided by IBM. The site allows users to upload their data and produce visualizations that others can view and comment on. Users have a wide range of visualization options available network diagrams, scatter plots, matrix charts, bar charts, histograms, bubble charts, line graphs, stack graphs, pie charts, tree maps, word trees, tag clouds, word cloud generator, as well as the maps of the world and US. Chartle (Beginner)
Chartle is a free online data visualization service that offers simplicity, ubiquity, and interactivity, in the creation of your charts and their publication online. Chartle offers users a wide range of data visualization options; users can create bar charts, column charts, pie charts, line charts, area charts, scatter plots, Venn diagrams, radar charts, organization charts, data tables, automated timelines, motion charts, gauges, and a wide variety of maps including simple maps, US and world intensity maps, address maps, and latitude/longitude maps. Prefuse (Advanced)
Prefuse is a visualization toolkit that contains a set of software tools for creating rich interactive data visualizations. In addition to offering features for data modeling, visualization, and interaction, Prefuse also provides optimized data structures for tables, graphs, and trees, a host of layout and visual encoding techniques, and support for animation, dynamic queries, integrated search, and database connectivity. Piktochart (Beginner)
Piktochart deals with an online tool for creating presentations and infographs which allow users to create interactive and informative charts without the need of Photoshop skills. Infogr.am (Beginner)
A website that lets users create their own infographics in a simple and structured manner. Weave (Intermediate)
Weave (BETA 1.0) is a new web-based visualization platform designed to enable visualization of any available data by anyone for any purpose. Weave is an application development platform supporting multiple levels of user proficiency novice to advanced as well as the ability to integrate, disseminate and visualize data at nested levels of geography. DataViz (Beginner)
A suite of powerful drupal-datavisualization modules.
Analysis, Graphic and Enterprise Tools
 Tableau (Beginner)
 Tablaeu offers free and professional software for data analysis, business intelligence and data visualization. Hohli (Beginner)
Hohli is an online chart builder which allows you to create line charts, bar charts, pie charts, venn diagrams, scatter plots, and radar charts for free without needing to download any software. Charts can be horizontal, vertical, or square, and can also be created in different sizes. iCharts (Intermediate)
Specialises in small chart widgets. Gliffy (Intermediate)
Online diagram and flowchart software.
Google's Charting and Visualization Tools
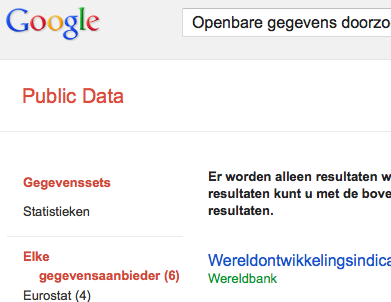 Google Public Data Explorer (Beginner)
The Google Public Data Explorer is an online visualization tool that enables users to easily explore and visualize large data sets. Googles motion charts make it very easy to see and understand the changes as they have happened. The Explorer can be used by anyone who wishes to create visualizations of public data, link to them, or embed them in their own webpages. Additionally, embedded charts and links can update automatically, thereby providing the user with the ability to always share the latest available data. Google Fusiontables (Beginner)
This online database and mapping tool has become a default for producing quick and detailed maps, especially those where you need to zoom in. You get all the high resolution of google maps but it can open a lot of data - 100mb of CSV, for instance. Google Spreadsheets (Beginner)
Googles tool for creating datacharts.They are pretty design-neutral, which is useful in small charts. The line charts have some nice options too, including annotation options. Google Chart (Intermediate)
Google chart offers powerful, simple to use, and free tools for generating interactive data charts.
Tools for Visual Programming of Languages and Environment
 Flare (Advanced)
Flare is an ActionScript library for creating visualizations that run in the Adobe Flash Player. From basic charts and graphs to complex interactive graphics, the toolkit supports data management, visual encoding, animation, and interaction techniques. Additionally, flare features a modular design that lets developers create customized visualization techniques. Data-Driven Documents (Advanced)
A JavaScript library for manipulating documents based on data. D3 helps you bring data to life using HTML, SVG and CSS. D3s emphasis on web standards gives you the full capabilities of modern browsers without tying yourself to a proprietary framework, combining powerful visualization components and a data-driven approach to DOM manipulation.
Tools for Mapping
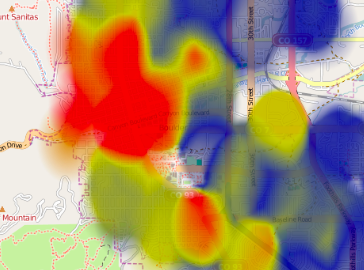 Open Heat Maps (Beginner)
Open Heat Map is an incredible tool created by Peter Warden that lets you create your own heat maps in literally seconds with either an Excel spreadsheet or a Google Docs spreadsheet. You can use the maps to illustrate patterns, highlight intensity levels, showcase regional differences, and much more. Geocommons (Advanced)
GeoCommons is an online data visualization site that allows users to create and share geographic data, maps, and analysis. Users can easily create rich interactive visualizations to solve problems without any experience using traditional mapping tools. Statsilk (Intermediate)
Statsilk allows you to make interactive datamaps. Chartsbin (Beginner)
A tool for creating clickable world maps. Colorbrewer (Beginner)
Not, strictly speaking, a visualisation tool, Color Brewer - originally designed with federal funding and developed at Penn State - is really for choosing map colors, and is worth spending some time with if plan to make many more. You can choose your base colour and get the codes for the entire palette. Diagramly (Beginner)
Diagramly is an online drawing application that can be used to visualize relationships, organization charts, networks, database schema, and other information. It can also be used to depict telecommunication networks, workflows, flowcharts, map overlay and GIS, electronic circuits, social network diagrams, business process management (BPM), business process modeling notation (BPMN), and UML. NewRadial (Beginner)
NewRadial is a program created specifically for the visualization of humanities data. Using this software, users can create nodes, create and edit commentary for a group of related nodes, edit connecting information as well as search results.
Word- / Tagclouds
Wordle is an online software for creating word clouds from any text the user wishes the clouds give greater prominence to words that appear more frequently in the source text. To make the visualizations appealing, users have the ability to modify their clouds with different fonts, layouts, and color schemes. Tagxedo (Beginner)
Another wordcloud site with a bit more versatility. Cloud Combinator (Beginner)
Handy tool for making tagclouds. Tagcrowd (Beginner)
TagCrowd is a web application for creating word clouds, also known as text clouds or tag clouds.
Personal Tools
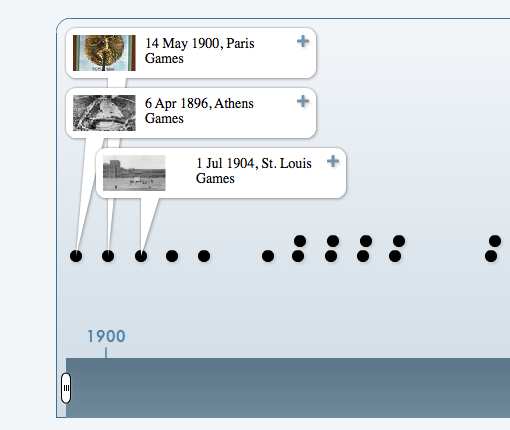 Dipity (Beginner)
Dipity is a free online digital timeline website that allows users to create free interactive timelines online. With Dipity, users can create, share, embed and collaborate on interactive, visually engaging timelines that integrate video, audio, images, text, links, social media, location and timestamps.
Timetoast (Beginner)
Timetoast is an online application that allows users to create free interactive timelines which can be shared anywhere on the web.
Specialist Tools
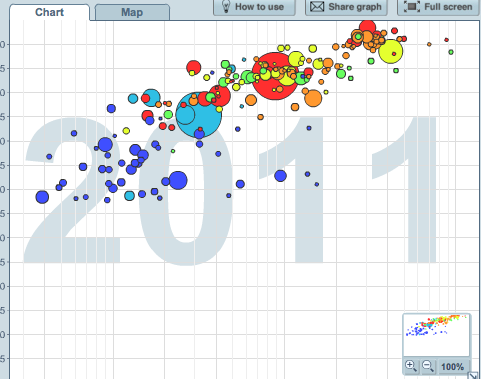 Gapminder (Beginner)
an interactive software that allows the user to communicate, through animated graphics, with a plethora of statistics and see the relation between them, from various economic indicators to infrastructure development, from education statistics to climate and health conditions. Gapminder Desktop can be downloaded to use the service offline. Flowing Data (Advanced)
FlowingData explores how designers, statisticians, and computer scientists are using data to understand ourselves better mainly through data visualization. (also tutorials) DataMarket (Intermediate)
Better-known as a data supplier, Datamarket is actually a pretty nifty tool for visualising numbers too. You can upload your own or use some of the many datasets they have to offer - but the options do get better if you get the Pro account.
Collection of Tools
 Datavisualization.ch Selected Tools
A carefully selected list of recommended tools for datavisualization, information visualization, data, infographic, map, chart, graph, diagram, design, programming and analysis. DailyTekk
Over 100 incredible infographic tools and resources (categorized). The Guardian
Some of the most useful visualization tools according to British newspaper The Guardian. Degreecentral
17 free data visualization tools.
Data Visualization vs. Infographics
Infographics
Infographics are information represented in form of visual graphics, aiming at providing a immediate and clear understanding of facts, events or data. Though information graphics and data visualization do not have to be intended as synonyms: although they represent a peculiar form of data visualization, infographics may not be related with data themselves. Thus an infographic can be considered either a tool or a branch of data visualization, and data visualization may be a goal and a reason for creating infographics. Information graphics are used in the fields of information design and information architecture as well for their capacity to improve cognition of complex information."How to"- Publications
- Infographic: Do-It-Yourself Guide to Infographics Marketing Tech Blog
- The Dos and Donts of Infographic Design Smashing Magazine
- Design a Magazine Infographic Digital Arts
- How to Create Great Infographics .net magazine
- The Anatomy of an Infographic SpyreStudios
- 7 Steps to Make Your Infographic a Success SEOmoz
Javascript / Flash- Infographic Tools
- KeyLines - A JavaScript toolkit for visualizing networks.
- d3.js - Free JavaScript library for manipulating documents based on data.
- InfoVis Toolkit - A JavaScript tool for creating interactive data visualizations.
- Flare - Makes it easy to create interactive data visualizations (ActionScript).
- JS Charts - Free JavaScript charts.
- FusionCharts - JavaScript (HTML5) and Flash charts.
- JavaScript and HTML charts.
- Highcharts - Interactive JavaScript charts.
Few topics are better suited than geography for examination as an infographic. These geography infographics span topic from tsunamis to cartography.


Edit | Attach | Print version | History: r14 < r13 < r12 < r11 | Backlinks | View wiki text | Edit wiki text | More topic actions
Topic revision: r14 - 22 Sep 2014, MaxKortlander
Topics
- Searching & Collecting
- Journal Guide
- Web & Blog Guide
- Research Communities
- Amsterdam Scene
- Amsterdam New Media Industry
- New Media Events
- New Media Methods
- Visualising Theories
- Key Works
- Academic Writing Guide
- Data Tools
- Data Visualisation
- Web Stats
- Research Apps
- Secondary Social Media
- Privacy
- Collaboration
Ideas, requests, problems regarding Foswiki? Send feedback