You are here: Foswiki>Dmi Web>WinterSchool2016>WinterSchool2016ProjectPages>WinterSchool2023WorldAccordingToTikTok (06 Feb 2023, NatalieKerby)Edit Attach
The World According to TikTok
Team Members
Facilitators: Salvatore Romano (Tracking Exposed), Miazia Schueler (Tracking Exposed, University of Amsterdam), Natalie Kerby (Tracking Exposed, University of Amsterdam), Davide Beraldo (University of Amsterdam) Participants: Antonio Sacchet (Designer), Arthur Lee, Ayoub Samadi, Çağla Onaran, Dexter Adams, Emma Ruiter, Fenna van Dijk, Goran Kusic, Jelin Schut, Julia Wolska, Lara Dal Molin, Maja Akdemir, Noor van de Loo, Simon Fern, Soumya Khedkar, Yasmin Din, Zhuoni ChenContents
1. Introduction
With 1 billion monthly active users spread across 141 countries (Dean), TikTok has recently become one of the most popular and potentially influential digital platforms on a global scale, especially amongst younger demographics. The genre of videos shared on the platform ranges between music, dances, challenges, pranks, and increasingly includes educational, informational and, more generally, politically charged content. TikTok content moderation and promotion/demotion strategies are currently under scrutiny and at the center of controversies (Romano et al. “Mapping Ban and Shadow-Ban on TikTok.”; “Shadow-Promotion: TikTok ’s Algorithmic Recommendation of Banned Content in Russia.”). TikTok ’s main access point to content is its For You Page (FYP), a continuous feed of content that is algorithmically curated by the platform’s recommendation system (TikTok). This recommendation system is based on a combination of factors, such as inferred user interests and interactions, video information, device and account settings, as well as the device’s and user’s geographical location. Focusing on the latter, this project studies the FYP from a cross-national perspective by investigating emerging patterns, trends, concerns, and thematic clusters when (non-authenticated) users access TikTok in different countries. We therefore ask, what kinds of patterns emerge across different regions of the world? What algorithmically-driven cross-national boundaries and proximities can we map out? Our goals are to:-
map networks, discourses, trends, and key actors promoted by TikTok in a cross-national fashion;
-
understand how TikTok draws algorithmically-mediated proximities and boundaries amongst geographic regions;
-
highlight how TikTok navigates controversial and/or contested issues in different regions.
3. Research Questions
1. How does TikTok map algorithmic proximities and digital boundaries between countries? 2. How does TikTok algorithmically represent discourses, languages and audio on a cross-national level? 3. How does TikTok algorithmically represent and moderate human rights issues in different geographical and cultural contexts?4. Initial Datasets
In preparation for this investigation, Tracking Exposed collected two separate datasets containing TikTok FYP data from June-July 2022 (‘summer’ dataset) and December 2022 (‘winter’ dataset). Each dataset consists of the first 8 videos that appear on the FYP of a non-logged-in TikTok user across 197 countries, scraped up to 4 times a day. Therefore, personalization patterns are not considered in this collection, since no logged profiles have been used. Both datasets consist of roughly 300.000 recommended videos, in each of which around 47.000 are unique. Metrics include country, description, video ID, authors/account, author ID, views, likes, hashtags, shares, upload date, date of extraction, and more. This data collection relies on the Residential IPs Network developed by BrightData. There are limitations to the datasets. The ‘summer’ dataset is missing some key data in June, and both the summer and winter datasets encountered errors on particular days in certain countries, meaning that not every country has the exact same amount of videos present in the dataset.5. Methodology & Findings
Digital Borders To yield an overview of our dataset, we conducted a network analysis to visualize how content is shared or differs between countries. Using Gephi, we created a bipartite network linking the nodes’ Video ID (which is unique to each video) to Country (the country whose FYP the video appeared on). Since Video ID is unique, creating a network with this field allows us to see what countries a particular video is linked to; whether it is specific to a region or shows up frequently around the world. While we utilized both the summer and winter datasets in this initial research, they each returned similar results. Therefore, we continued our deeper analysis focusing solely on the winter dataset. Since the initial dataset from Tracking Exposed did not contain regions and sub-regions, we added categorizations of continents and sub-regions based on the United Nations geoscheme (United Nation, 2019). With the understanding that all geographic categorizations are inherently political, we took the liberty to modify the UN’s categories to better suit our needs. For example, we decided to group North Africa and West Asia together into a Middle East and North Africa (MENA) region, as we expected the cultural and linguistic ties of these nations to better appear in the visualizations. Indeed, anomalies in the findings can often be explained via contentious categorization. For example, despite being a border country between Europe and Asia, Turkey very much clusters with the rest of West Asia. In this we can see cultural-geographic categorizations mediated by TikTok. In examining the macro distribution of videos on TikTok, we were able to sketch a ‘World According to TikTok ’ map from the winter dataset, as seen in Figure 1. The clusters formed in Figure 1 demonstrate a parallel with where countries sit geographically.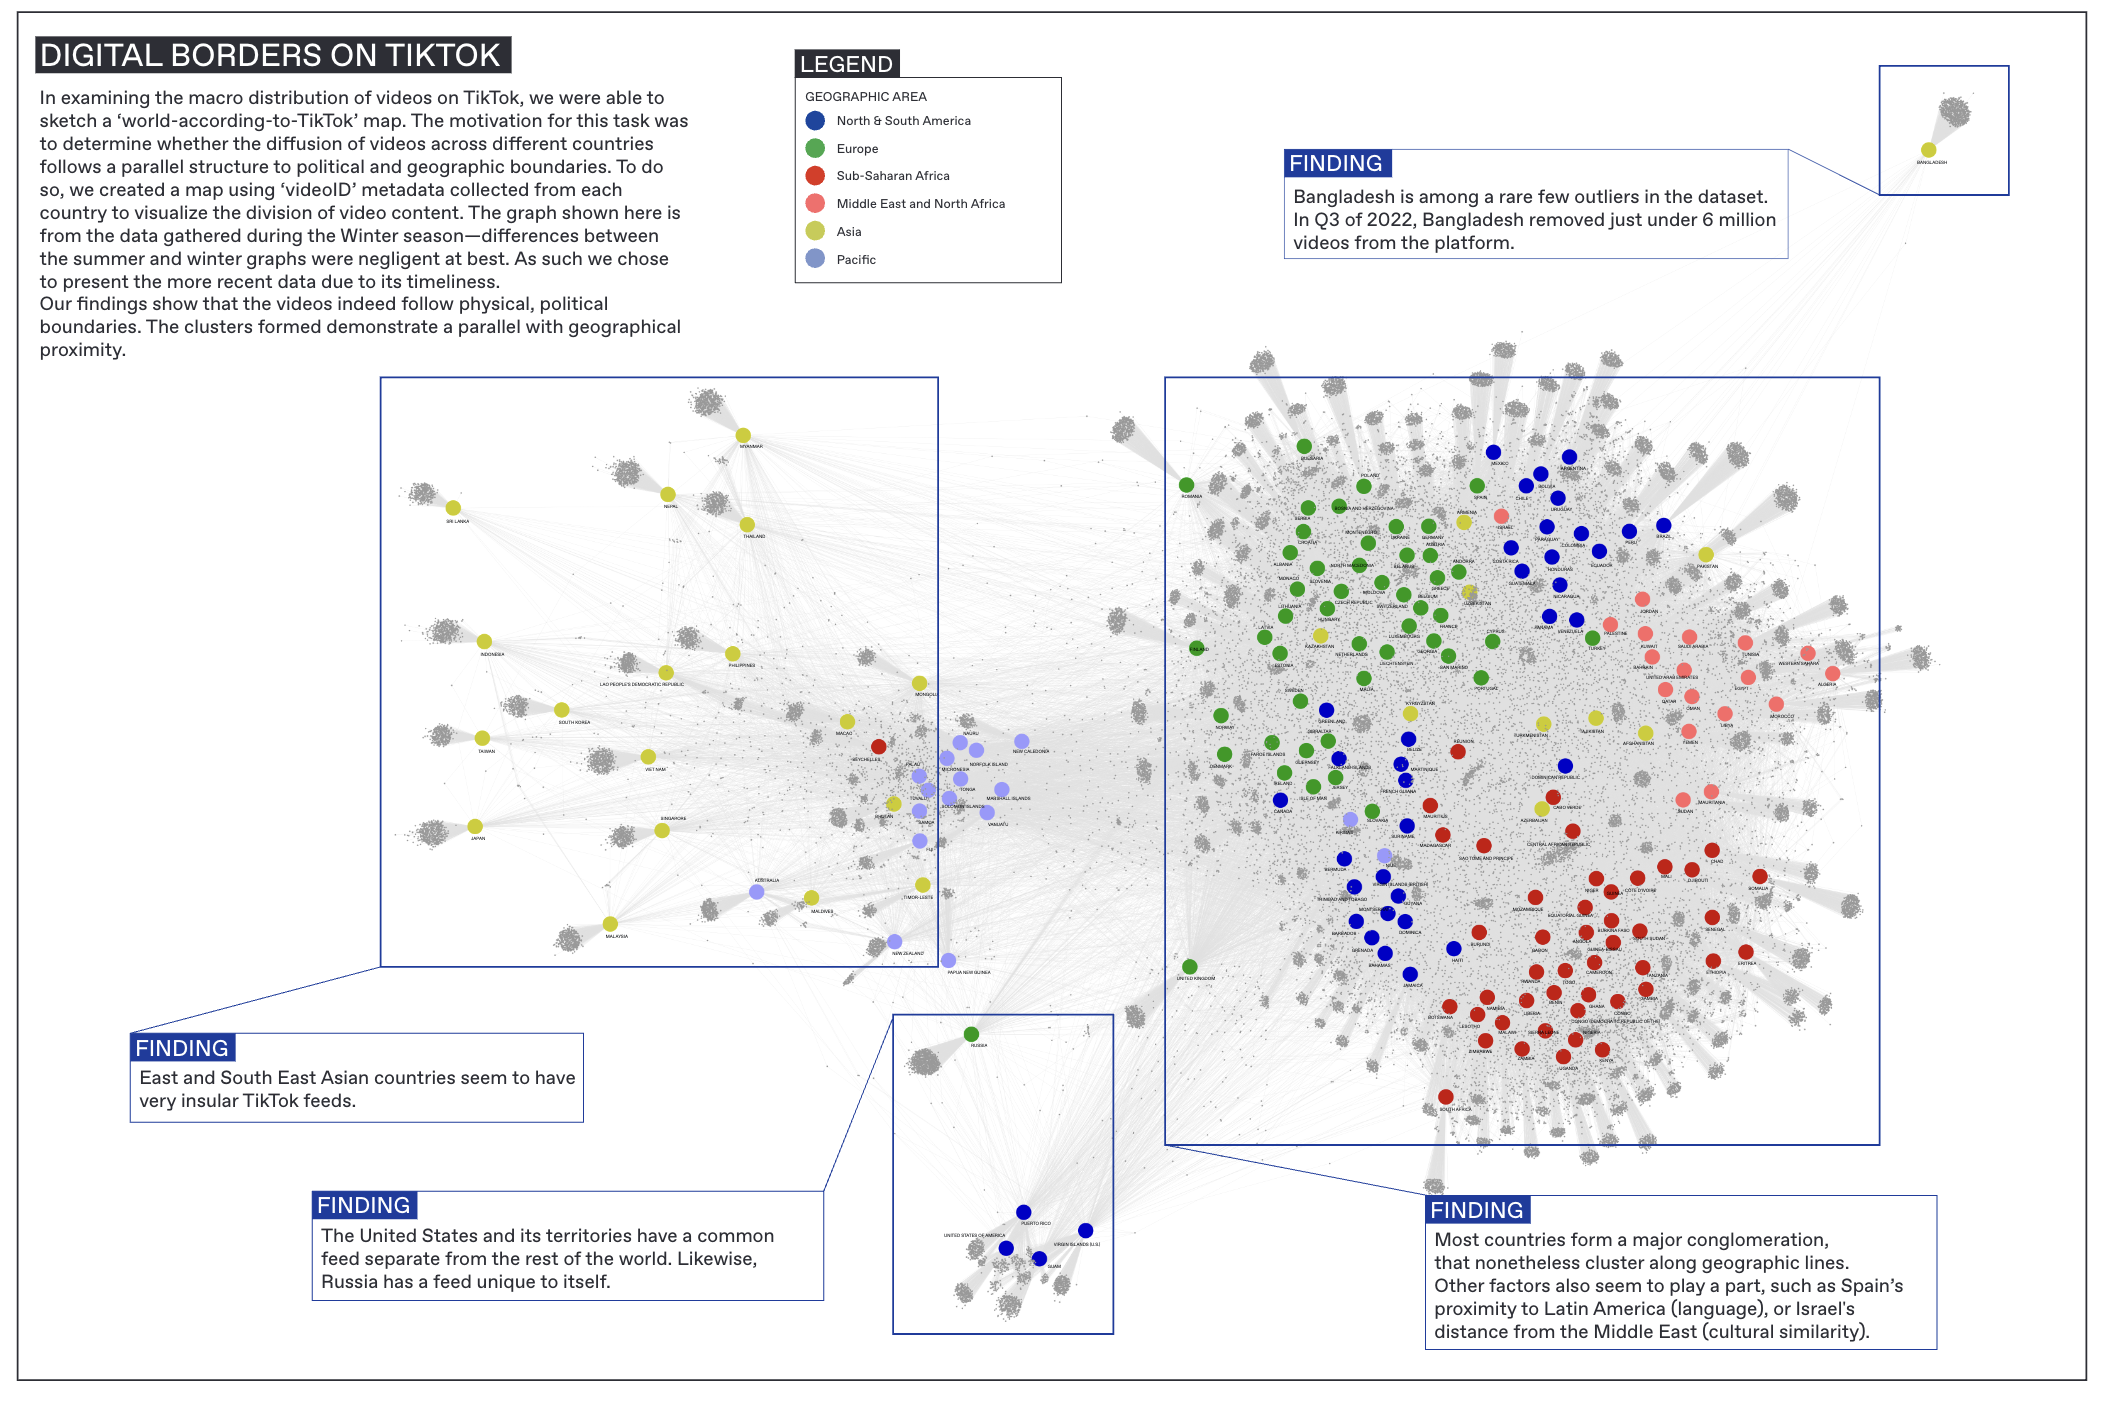 Figure 1. A bipartite Gephi network showing connections between video ID and country.
There were many similarities in content across geographic lines. For instance, we took Israel as a country of reference, and found that it had 224 videos in common with Afghanistan, 259 in common with Portugal and 314 in common with Palestine. This showed that while Israel is closest geographically to Palestine, there are still significant commonalities with the FYPs of other locations.
Some countries, however, were more isolated by sub-region. For instance, we noted that countries within South America, Europe, Africa, the Middle East, the Pacific Island and South Asia were clustered by region. South-East and East Asian countries were the most isolated by country within their sub-regions, whereas European countries had many more shared videos.
Additionally, we noticed various outliers, which include Bangladesh, Russia, and the United States. The US formed a small cluster of its own including some of its territories (Puerto Rico, Virgin Islands and Guam). Russia, Bangladesh, and the US also adopt strict media censorship regulations, with the US having the most removed videos on TikTok as of Q3 2022 (The Daily Star).
Languages
To consider whether the FYPs showed more international or national content, given each country had videos in multiple languages, we used the video description’s language as a proxy. We uploaded the winter dataset to Google Sheets and used [=DETECTLANGUAGE()] to detect the language. There are two main limitations to this method. First, is that the description language does not necessarily reflect the language spoken in the video. Second, description language is not a foolproof way to determine a video’s origin (e.g. a Danish creator could still create a video in English that appears on the Danish FYP).
Once we had the language of the descriptions, we coded each country by its official language according to a pre-existing dataset (Brizinov) combined with Wikipedia information, accounting for countries with multiple official languages. We used a python script to calculate the proportion of videos in a country’s official language, by matching the video’s description language and the official languages of the country. We then conducted further analysis on those where the proportion showed close to 100% or 0% of videos in the official language. We then plotted all of our proportions on a map to visualize the differences.
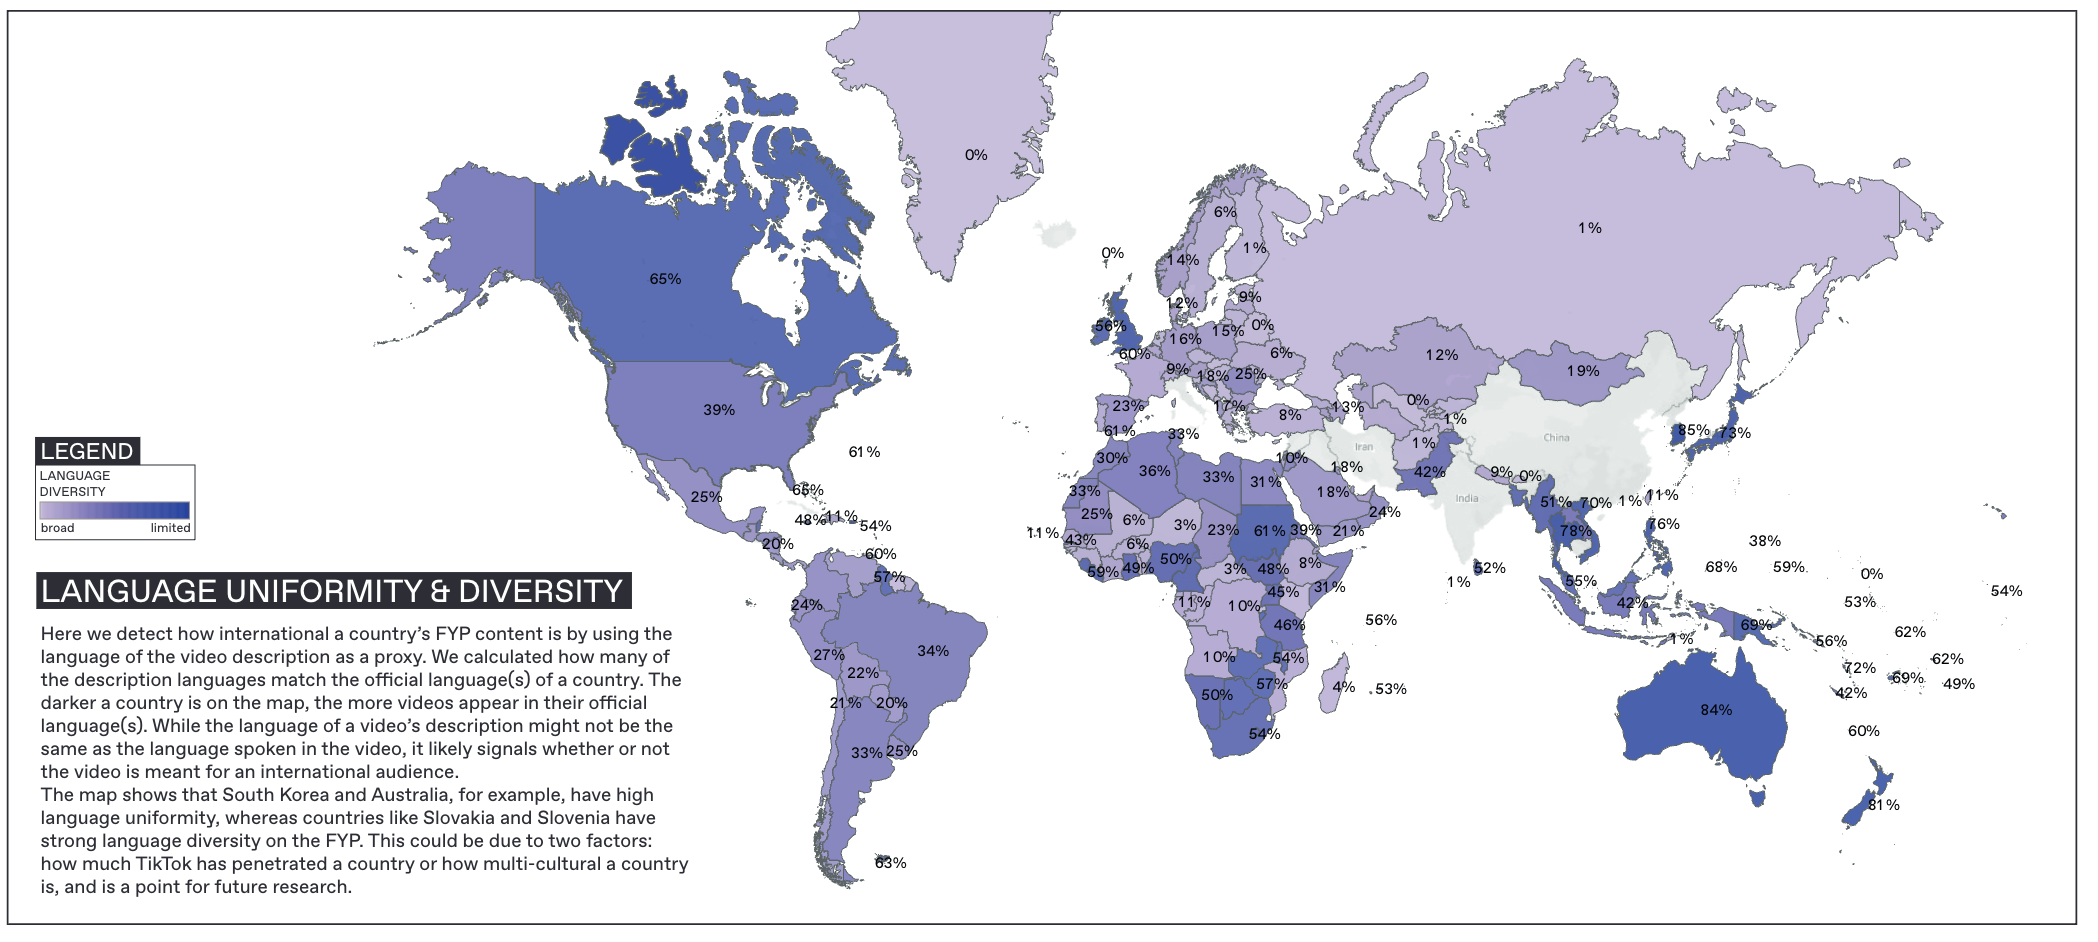 Figure 2. A map displaying the percentage of content in a country's official language.
In Figure 2 we show the proportion of "internationality” of a country’s FYP content by using the language of the video description as a proxy. The darker a country is colored on the map, the more videos appear in their official language(s). While the language of a video’s description might not be the same as the language spoken in the video, it likely signals whether or not the video is meant for an international audience. The map shows that South Korea and Australia, for example, have high language uniformity, whereas countries like Slovakia and Slovenia have strong language diversity on the FYP.
Queertok
This analysis sought to identify human rights issues in the FYP, which required a mixed-methods approach of quantitative and qualitative analysis. From an initial exploration of the hashtags and descriptions related to human rights issues, we found a strong presence of LGBTQIA+ videos. Therefore, we filtered for videos which specifically contain LGBTQIA+ related words and phrases in the hashtags and descriptions. Then, we performed a qualitative sentiment analysis of the remaining videos and removed all spam and irrelevant content. We deduced that all content was positive or neutral, with no homophobic content.
Considering this was initially done by English language only, we then moved to include more language diversity. Using the -strpos command in STATA, a statistical software, we created a dummy variable which coded videos with LGBTQIA+ relevant phrases in 15 major languages (English, French, German, Italian, Spanish, Polish, Russian, Ukrainian, Greek, Korean, Thai, Chinese (simplified.), Nepali, Japanese, Vietnamese). After determining which videos had LGBTQIA+ relevant phrases in their descriptions, we filtered the dataset to remove all others. We then performed a qualitative sentiment analysis of the remaining videos to double check whether these actually contained relevant content, and to qualify whether the content was neutral/positive, negative, irrelevant, or missing. Four researchers iteratively coded the 940 videos. We found that 311 videos were irrelevant and 200 videos were inaccessible, leaving us with a total of 429 TikTok videos that were LGBTQIA+ relevant and either neutral or positive. We found no negative videos about LGBTQIA+ issues overall.
As seen in Figure 3, we found that FYPs in the US, Puerto Rico, and Bhutan showcased at least 1 in 50 videos containing LGBTQIA+ related terminology in the description.
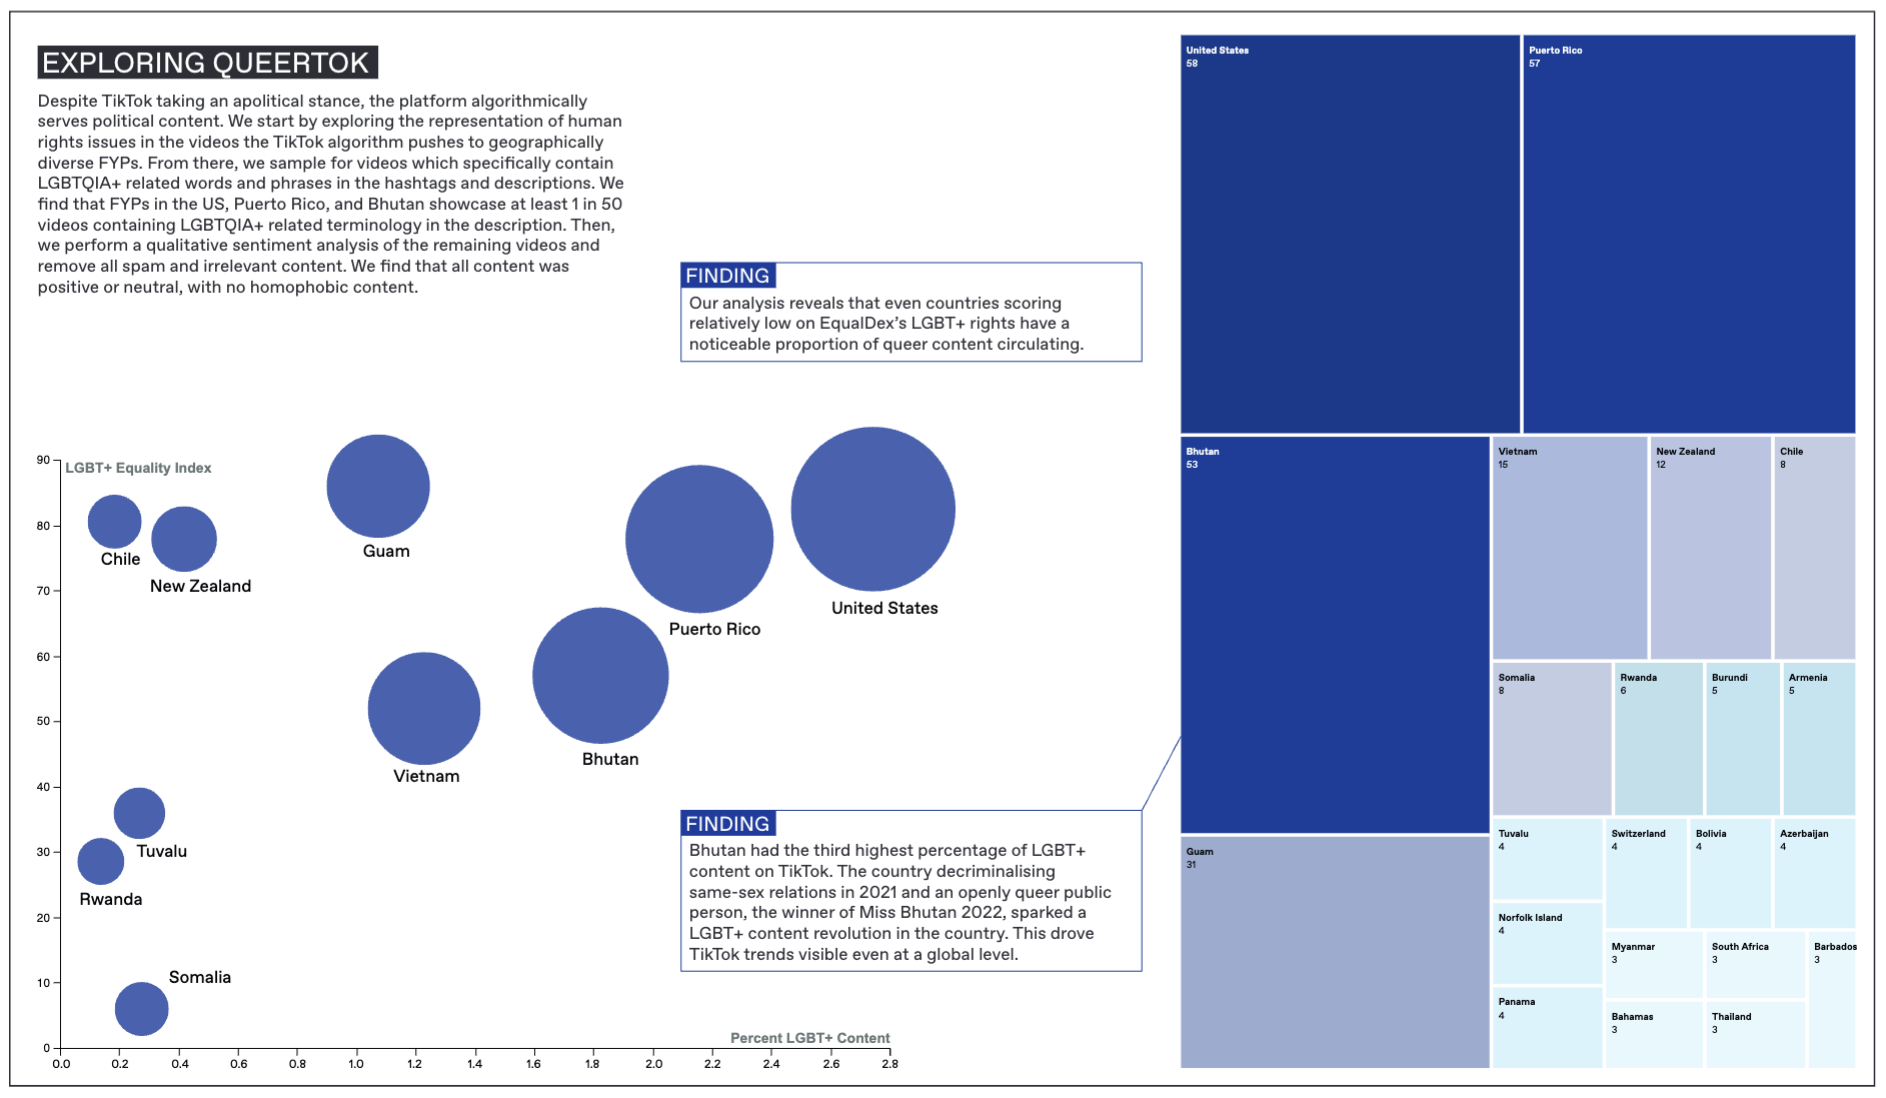 Figure 3. Charts showing countries with high levels of LGBTQIA+ content.
Whilst queer content is widely circulated in the US and Puerto Rico, Bhutan stood out. Further research revealed that Bhutan had decriminalized same-sex relations not long before the data was retrieved. Further research led us to beauty pageants: Miss Bhutan was not the first openly lesbian contestant to participate in Miss Universe, but she was the first openly lesbian Bhutanese celebrity to come out, and has become a path-breaking queer public figure in her country (Rogers). This catapulted Bhutan to third place in the list of LGBTQIA+ content on TikTok. This sparked an LGBTQIA+ content revolution, which translated into TikTok trends that persisted well after the event itself, and which is supported by our analysis concerning how queer content was labeled, perceived, and circulated on the platform.
Sounds of TikTok
TikTok is famous for hosting a good share of sound-based content, especially considering its potential role in driving virality. To understand the circulation of music through TikTok ’s FYP, we conducted a network analysis between sounds and countries, and then narrowed down to specific music artists. We first created a bipartite Gephi network with Sound and Country as nodes using the summer dataset. We found sounds to be strongly homogenic: most countries are exposed to the same TikTok sounds, meaning, certain sounds do not appear to be associated with particular regions.
We then sought to understand how real musical artists are presented by the TikTok FYP. We filtered our dataset to remove the data points that involved internal TikTok ‘sounds’ rather than genuine music. To do this, we compared the artists in our dataset to a list of top artists on TikTok in 2022 (Kaggle). We searched for the top 50 artists from the external list in our own dataset, and found 30 of them. We filtered the dataset accordingly, keeping only the occurrences of these 30 artists. We created a bipartite network of these artists and the countries, which was visualized on Gephi (Figure 4), to show the most popular TikTok artists and the countries in which they most frequently occur on the FYP.
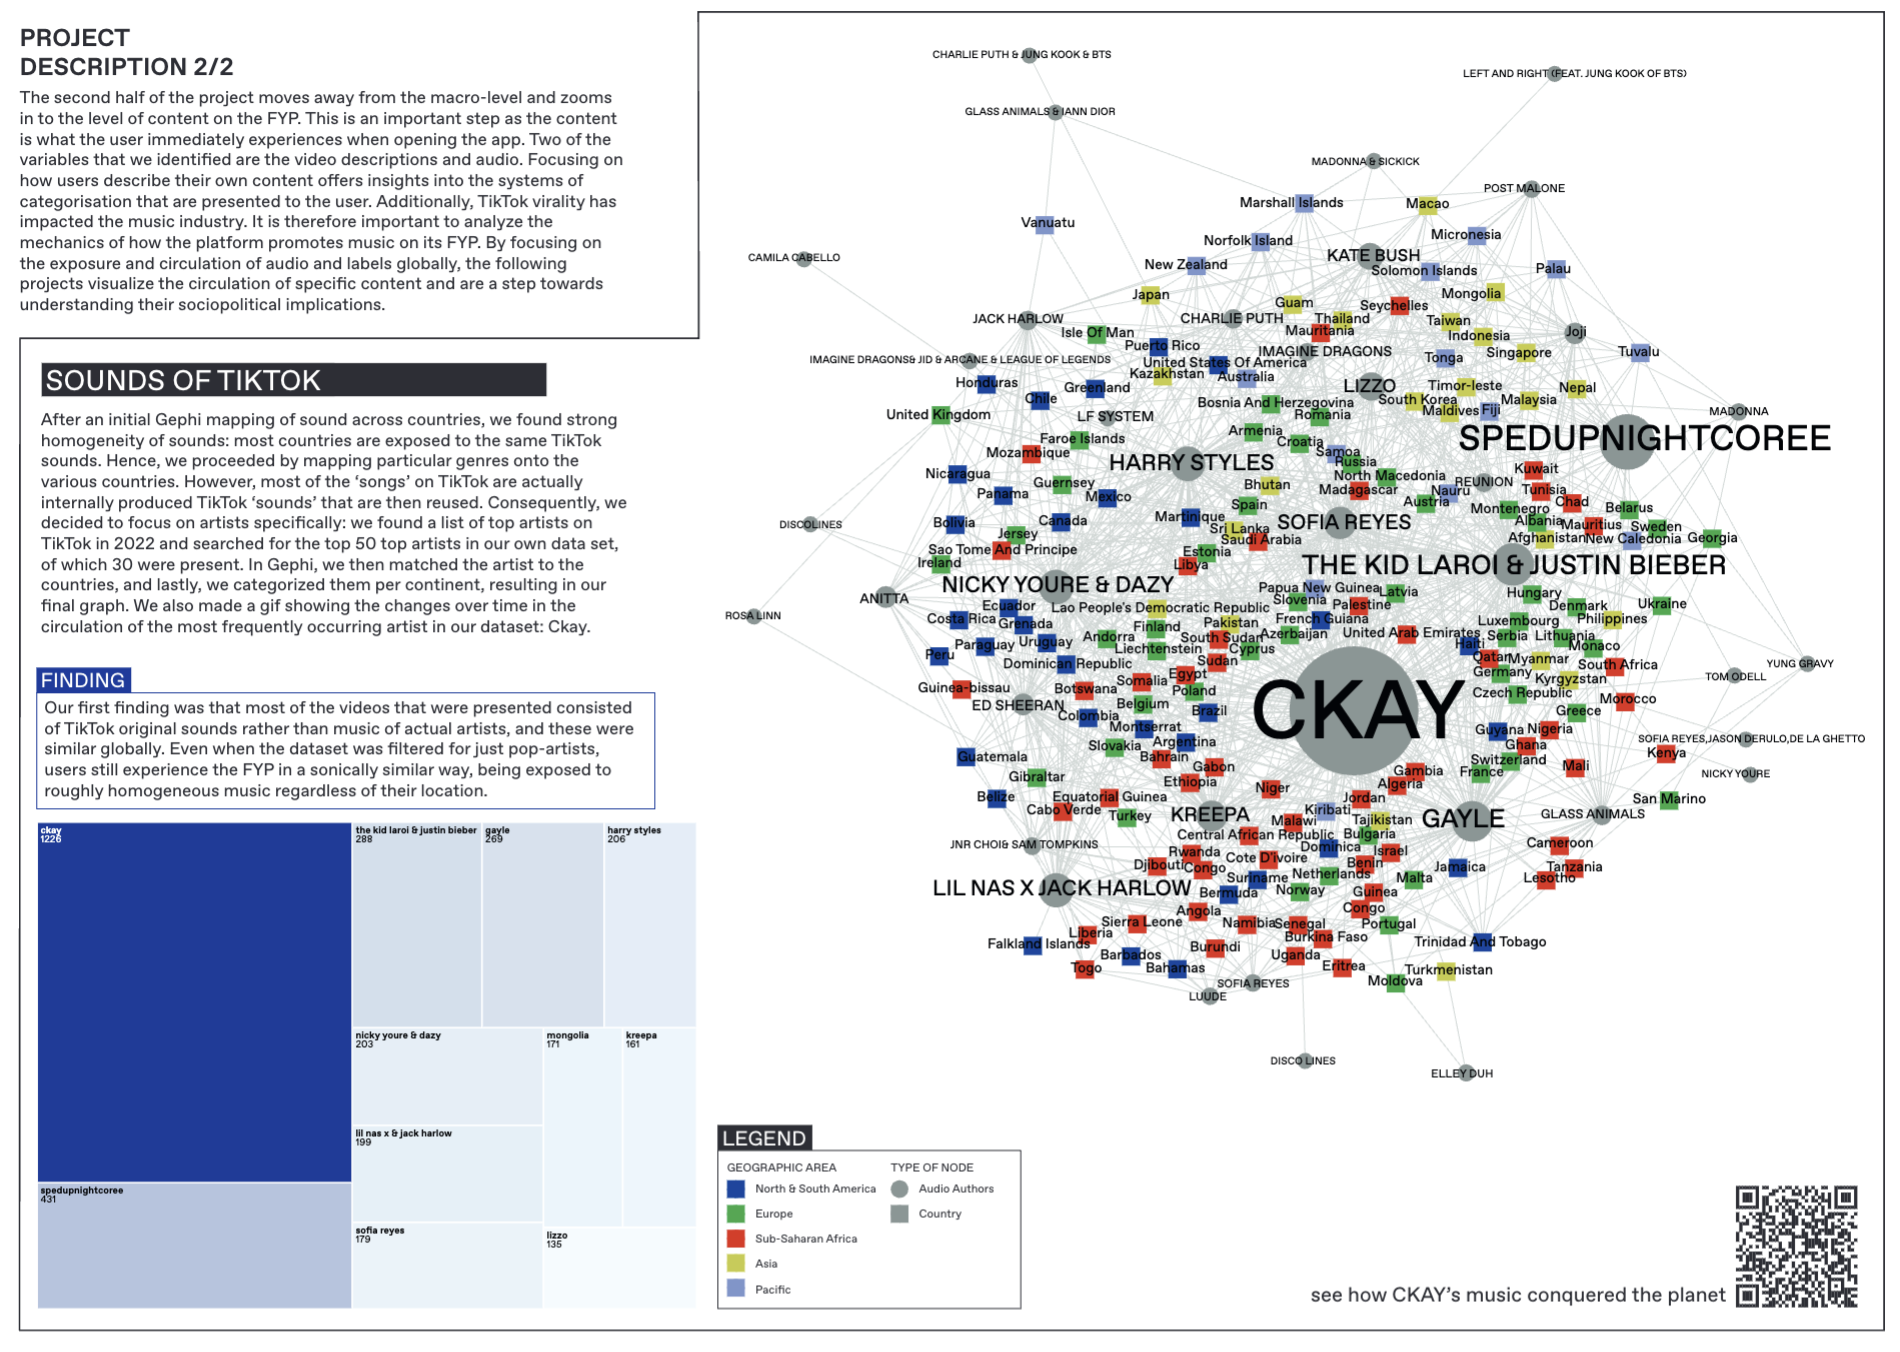 Figure 4. Sounds shared across the world.
In order to further understand the circulation of popular music, we also wanted to visualize a track’s progression temporally. Our most frequently occurring artist in the dataset was the Nigerian singer Ckay who had a viral hit with ‘Love nwantiti (ah ah ah)’, so we charted the global circulation of the track throughout the months of June and July that contains Tableau maps across weekly intervals, as seen in Figure 5.
.gif) Figure 5. GIF showing the spread of CKAY's song throughout the world over 2 months.
Hashtags and Labels
Hashtags are user generated, whereas labels are metadata produced by TikTok to categorize videos, enabling us to see what content types appeared on the various FYPs. While the dataset had a column for labels, we needed to extract hashtags from descriptions, which we did using a Python script. Next, we created two bipartite Gephi networks: one connecting video ID with hashtags and the other with labels to visualize content clusters from the user and platform perspective.
The two networks, as seen in Figure 6, are generic representations of content on regional FYPs. As such, they provide two interconnected views of TikTok content that can lead to further investigation. In the hashtag network, we clearly see clusters, which are similar to what we see in our initial, overarching map of TikTok videos.
Figure 5. GIF showing the spread of CKAY's song throughout the world over 2 months.
Hashtags and Labels
Hashtags are user generated, whereas labels are metadata produced by TikTok to categorize videos, enabling us to see what content types appeared on the various FYPs. While the dataset had a column for labels, we needed to extract hashtags from descriptions, which we did using a Python script. Next, we created two bipartite Gephi networks: one connecting video ID with hashtags and the other with labels to visualize content clusters from the user and platform perspective.
The two networks, as seen in Figure 6, are generic representations of content on regional FYPs. As such, they provide two interconnected views of TikTok content that can lead to further investigation. In the hashtag network, we clearly see clusters, which are similar to what we see in our initial, overarching map of TikTok videos.
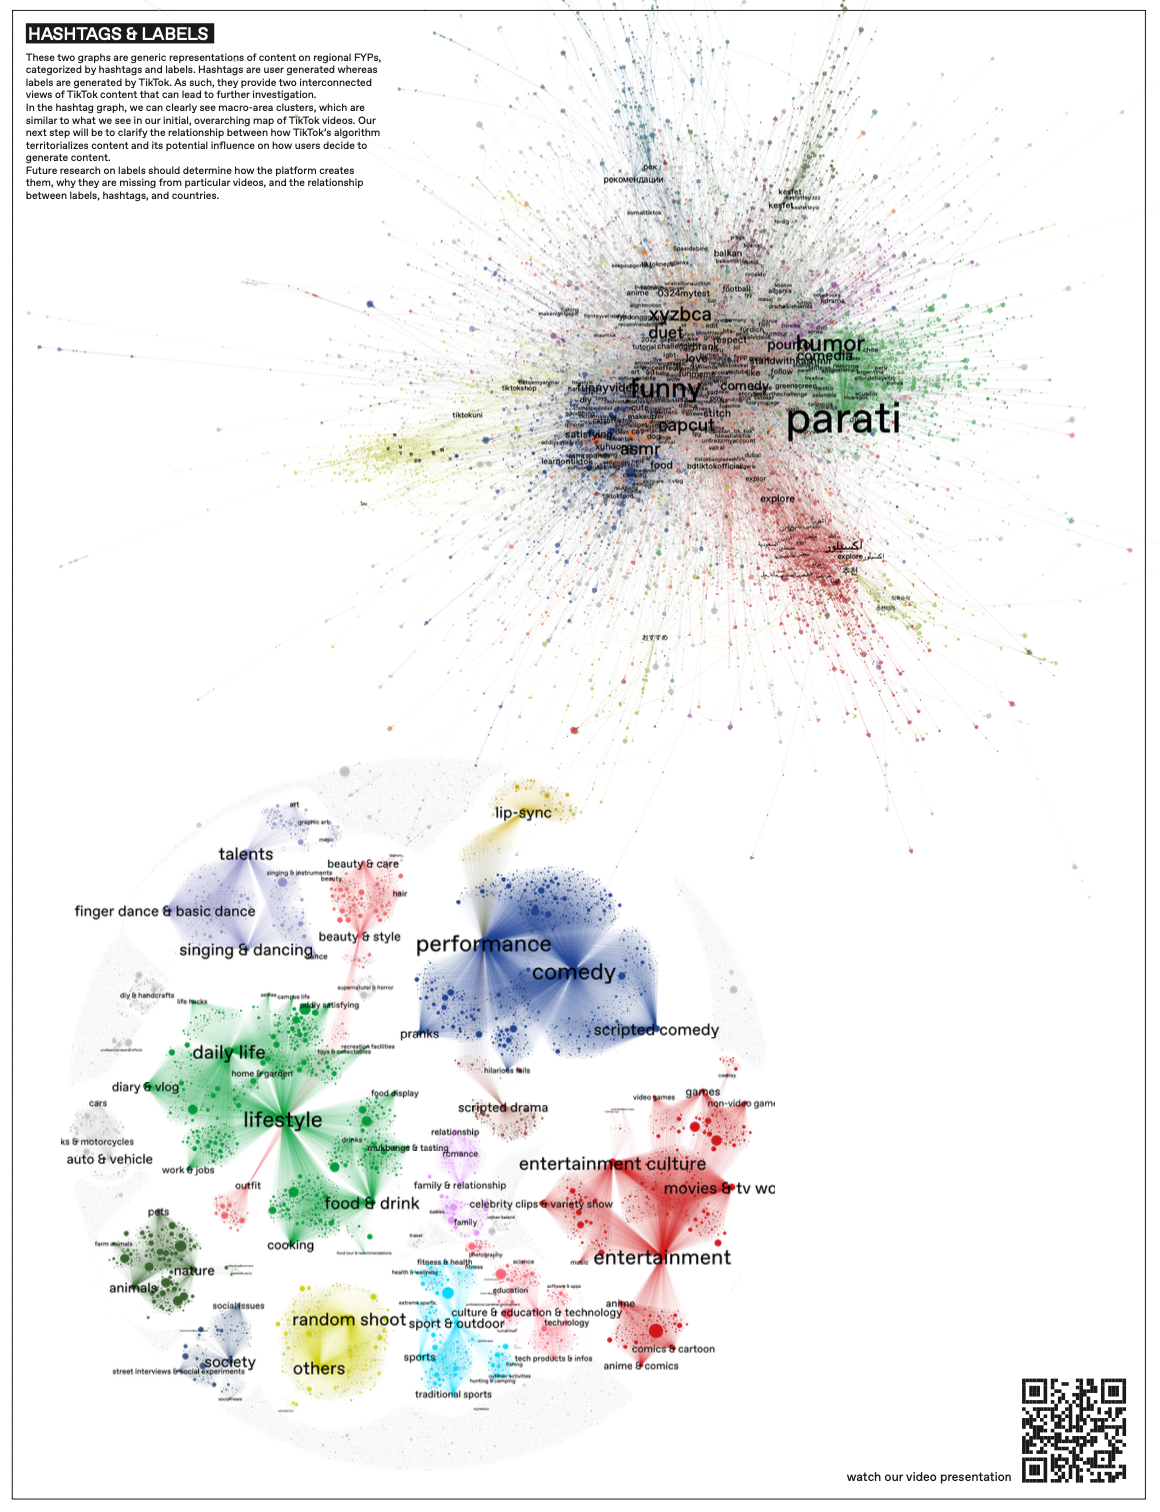 Figure 6. Two bipartite gephi networks of videos clustered by their hashtags and labels.
6. Discussion
In some areas, TikTok ’s prioritization of content is more attuned to geographic borders, whereas in others it clearly delineates along cultural lines. These differences also depend on which affordance we chose to look at. For example, while sounds were rather homogenous across all countries, the corresponding videos were much more segmented by culture or region. Sound, however, is not necessarily tied to content type, which likely feeds more into the geographic differences we found. Overall, videos did not always cluster on geographical grounds. For example, while Canada and the United States are both considered North America, Canada had much stronger proximity with Europe (Which could be do to French Québec). However, Southeast Asia and the Pacific were relatively close, despite Southeast Asian countries displaying strong levels of content isolation. At this level of analysis, we can only speculate why these similarities and differences may occur. It could be due to migration patterns, a country’s level of ‘multiculturality’, language, or geographic proximity/distance. For example, if a country has a high level of migration from another, this could explain why the two share similar content despite being geographically distant. Or, if a country is fairly homogenous in its population, the content might reflect that. Similarly, some countries have more than one official language, which may mean they share content with other countries that have the same official language. This is a point for further research. The language descriptions somewhat mapped onto the digital borders that we found. For example, Southeast Asian countries were rather isolated in terms of content and showed high language uniformity. However, this did not always line up with expectations. Per our analysis, Russia, for example, had fairly unique content, but those descriptions were predominantly not in Russian. This could suggest that initial FYP content depends on how much TikTok has penetrated a country or how many creators have reached viral enough status within a particular country. There were some instances of TikTok reflecting known political differences, such as that between Israel and Palestine. In our analysis, Israel sat between Europe and South America, and Palestine closer to the Middle East and North Africa, despite their geographic proximity and the Israeli occupation of Palestine. We don’t know, however, how much of these differences are a result of the platform’s prioritization of content versus the content that users produce in those specific regions. This ambiguity is true for the majority of our findings, since recommender systems mix users’ preferences with top-down virality metrics. And while TikTok claims to take an apolitical stance, the platform algorithmically serves content related to human rights issues, such as that around LGBTQIA+ issues. We want to underscore that in some countries this content is indeed political or controversial. Our findings in Bhutan suggest that TikTok is indeed influenced by real-world events, such as the first out lesbian Miss Bhutan, during a time in which the country was championing LGBTQIA+ rights. Outliers, such as the United States, Bangladesh, and Russia, also happen to be those countries where the most content removal happens. On top of this, we know from past Tracking Exposed reports that Russian content was siloed for a period of time at the start of the war (Romano et al. “Shadow-Promotion: TikTok ’s Algorithmic Recommendation of Banned Content in Russia”). This suggests that high levels of content removal may contribute to isolation.7. Conclusions
While we have found that TikTok ’s prioritization of content falls fluidly across geographic, political, and cultural lines, we still hope to clarify the relationship between how TikTok ’s algorithm territorializes content and its potential influence on how users decide to generate content. However, the fact that there is not one clear way that content is organized, suggests that TikTok does participate in shaping what content people in certain regions see, rather than strictly moderating by geographic bounds. Indeed, we cannot forget that it is a two way relationship, in that users also influence what content is available in the first place. In future research, we hope to unpack the relationship between users and TikTok more clearly, as well as follow inquiries that have arisen out of this analysis. For example, our further research on labels should determine how the platform creates them, why they are missing from particular videos, and the relationship between labels, hashtags, and countries. It should also explain why some videos have no labels. We may also look into the content differences between countries, such as Israel and Palestine, or understand better the isolation of Russia, Bangladesh, and the United States. Understanding how TikTok prioritizes content is important because it shows us how it shapes flows of information across the world, including shows us risks of censorship or “splinternets” where certain content or countries are limited in the types of information they can access.8. References
Brizinov, Sharon. “Countries and Their Spoken Languages - for Developers (Json,Csv,Xls)”. www.fullstacks.io/2016/07/countries-and-their-spoken-languages.html. Accessed 1 Feb. 2023. Dean, Brian. “TikTok User Statistics (2022).” Backlinko, 5 Jan. 2022, backlinko.com/tiktok-users. Accessed 1 Feb. 2023. Kaggle. “Tiktok Popular Songs 2022.” Kaggle, 22 Aug. 2022, www.kaggle.com/datasets/sveta151/tiktok-popular-songs-2022. Accessed 1 Feb. 2023. Rogers, Destiny. “Miss Bhutan 2022 Also 1st Openly Lesbian Public Figure.” QNews, 15 July 2022, qnews.com.au/miss-bhutan-2022-also-1st-openly-lesbian-public-figure. Accessed 1 Feb. 2023. Romano, Salvatore et al. “Mapping Ban and Shadow-Ban on TikTok.” Digital Methods Initiative Winter School, 2022. https://tracking.exposed/pdf/tiktok-russia-ShadowPromotion.pdf. Accessed 1 Feb. 2023. ——. “Shadow-Promotion: TikTok ’s Algorithmic Recommendation of Banned Content in Russia.” Tracking Exposed, 2022. https://tracking.exposed/pdf/tiktok-russia-ShadowPromotion.pdf. Accessed 1 Feb. 2023. The Daily Star. “TikTok Removes 6 Million Videos From Bangladesh.” The Daily Star, 27 Dec. 2022, www.thedailystar.net/tech-startup/news/tiktok-removes-6-million-videos-bangladesh-3206421. Accessed 1 Feb. 2023. TikTok. “How TikTok Recommends Videos #ForYou.” Newsroom | TikTok, 5 Nov. 2020, newsroom.tiktok.com/en-us/how-tiktok-recommends-videos-for-you.Edit | Attach | Print version | History: r1 | Backlinks | View wiki text | Edit wiki text | More topic actions
Topic revision: r1 - 06 Feb 2023, NatalieKerby
 Copyright © by the contributing authors. All material on this collaboration platform is the property of the contributing authors.
 Ideas, requests, problems regarding Foswiki? Send feedback


