You are here: Foswiki>Dmi Web>WinterSchool>RussoUkrainianWarFacebookEngagement (13 Feb 2023, KamilaKoronska)Edit Attach
The relationship between (hyper)partisan content and attention fatigue concerning the war in Ukraine on Facebook
Team Members
Matteo Bettini, Sam Bouman, Malin Holm, Emillie de Keulenaar, Kamila Koronska, Maria Lompe, Aistė Meidutė, Szilvi Német, Valentina Pallacci, Maria Plichta, Richard Rogers, Desislava Slavova, Jennie WilliamsContents
1. Introduction
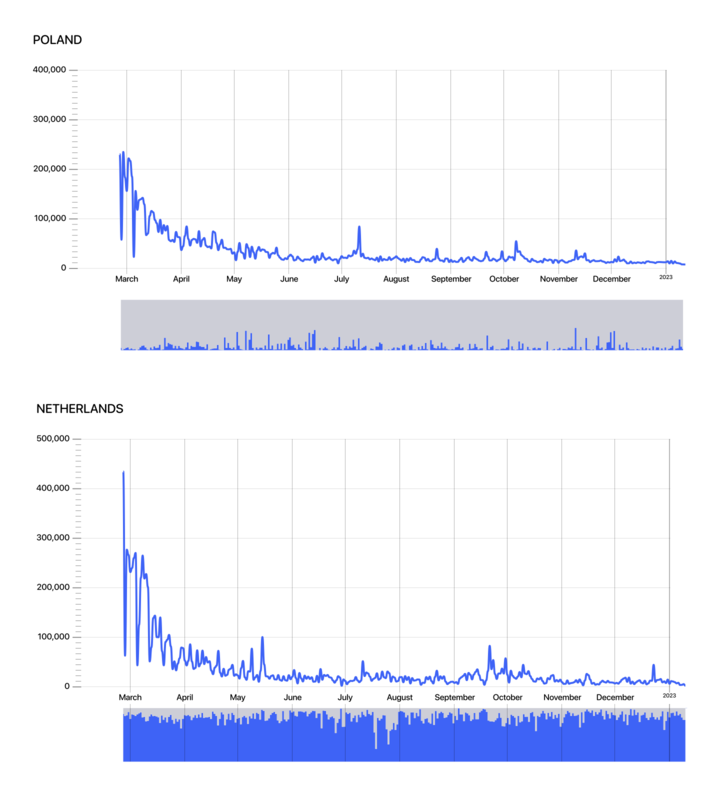
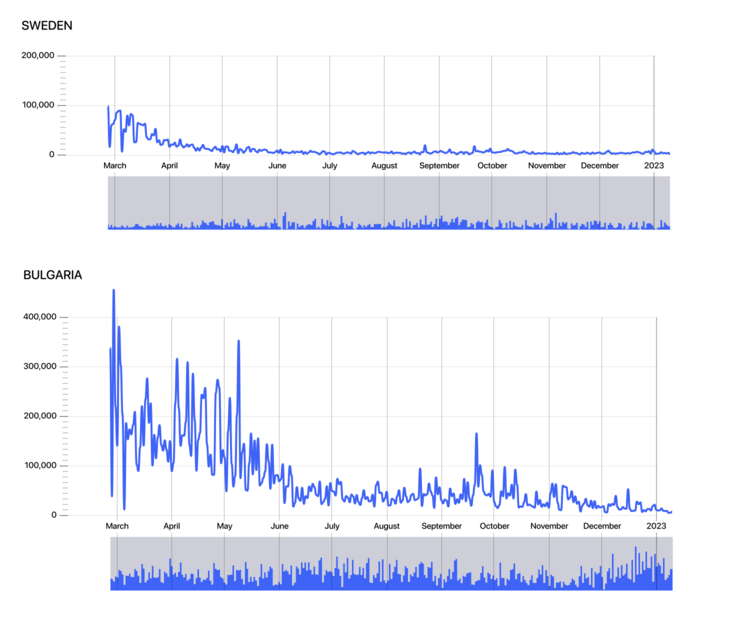
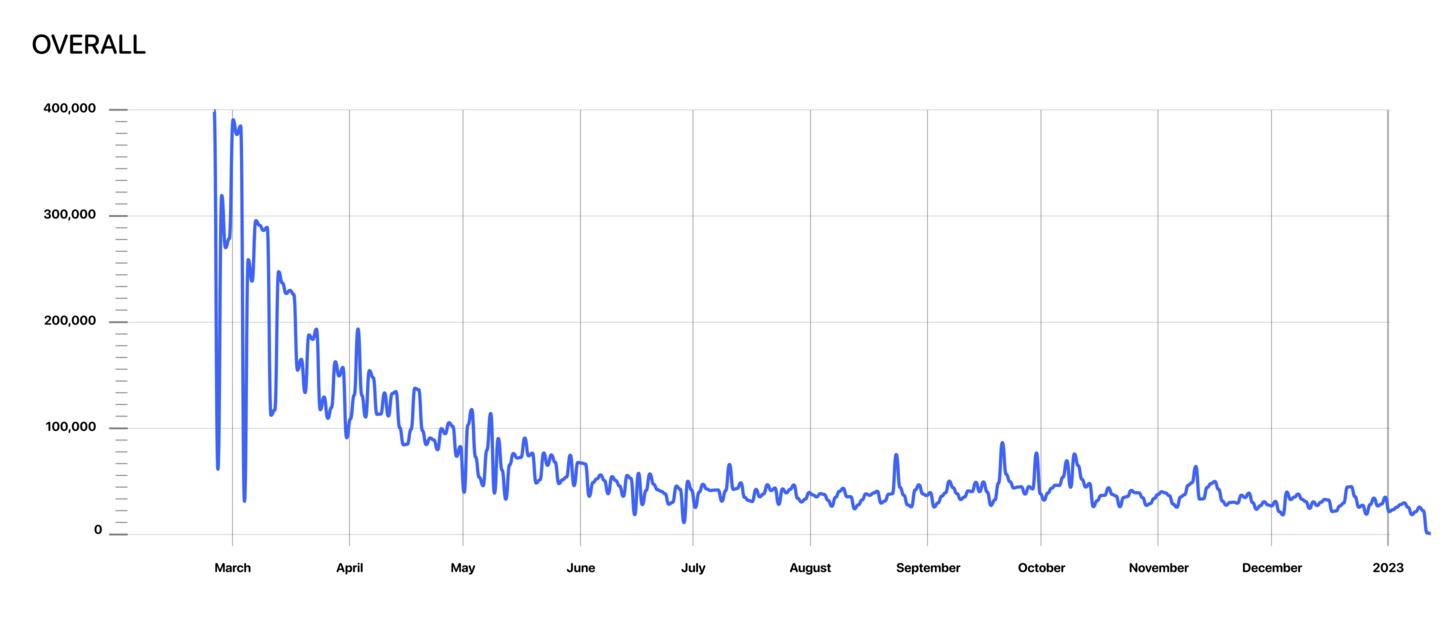
The research project enquires into the engagement surrounding the war in Ukraine on Facebook. It compares a series of eastern European countries (Bulgaria, Czech Republic, Lithuania, Poland and Slovakia), together with the Netherlands and Sweden. It found that overall the attention of the war has declined according to the engagement with war-related content on Facebook in each language. It also found that certain countries (particularly the Netherlands) exhibit more engagement with (hyper)partisan content than others. Finally, when examining the posts within which exclusively pro-Ukrainian or pro-Russian keywords appear, certain countries engage more with one side than the other, e.g., the Netherlands (with more pro-Ukrainian) and Bulgaria (with more pro-Russian3. Research Questions
How has the attention to the war in Ukraine evolved over time, according to Facebook interactions on war-related content, both per country as well as overall?4. Methodology and initial datasets
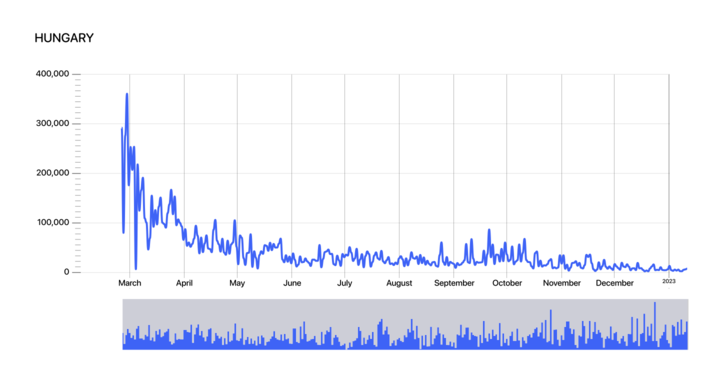
For both sets of research questions, create pro-Russian, proUkrainian and generic war keyword lists. Query Meta’s CrowdTangle for the keywords in Bulgarian, Czech, Dutch, Lithuanian, Poland, Slovakian and Swedish. Use pro-Ukrainian and pro-Russian keywords (together) as proxies for (hyper)partisan attention and generic keywords for general attention. Use pro-Ukrainian and pro-Russian keywords (separately) as indicators of sentiment. Compare (hyper)partisan attention to generic attention over time and pro-Ukrainian versus pro-Russian sentiment per country. The visualisations are line charts and stream graphs. The line charts display the amount of engagement with war-related Facebook posts over time, both per country as well as overall. At the base of the line charts are small stream graphs that show the share of engagement with (hyper)partisan content or more generic content. The larger stream graphs depict the share of pro-Ukrainian or pro-Russian content engagement overtime per country. The visualisations are line charts and stream graphs. The line charts display the amount of engagement with war-related Facebook posts over time, both per country as well as overall. At the base of the line charts are small stream graphs that show the share of engagement with (hyper)partisan content or more generic content. The larger stream graphs depict the share of pro-Ukrainian or pro-Russian content engagement overtime per country.5. Findings
We observed that overall the attention of the war has declined according to the engagement with war-related content on Facebook in each language. We also found that certain countries (particularly the Netherlands) exhibit more engagement with (hyper) partisan content than others.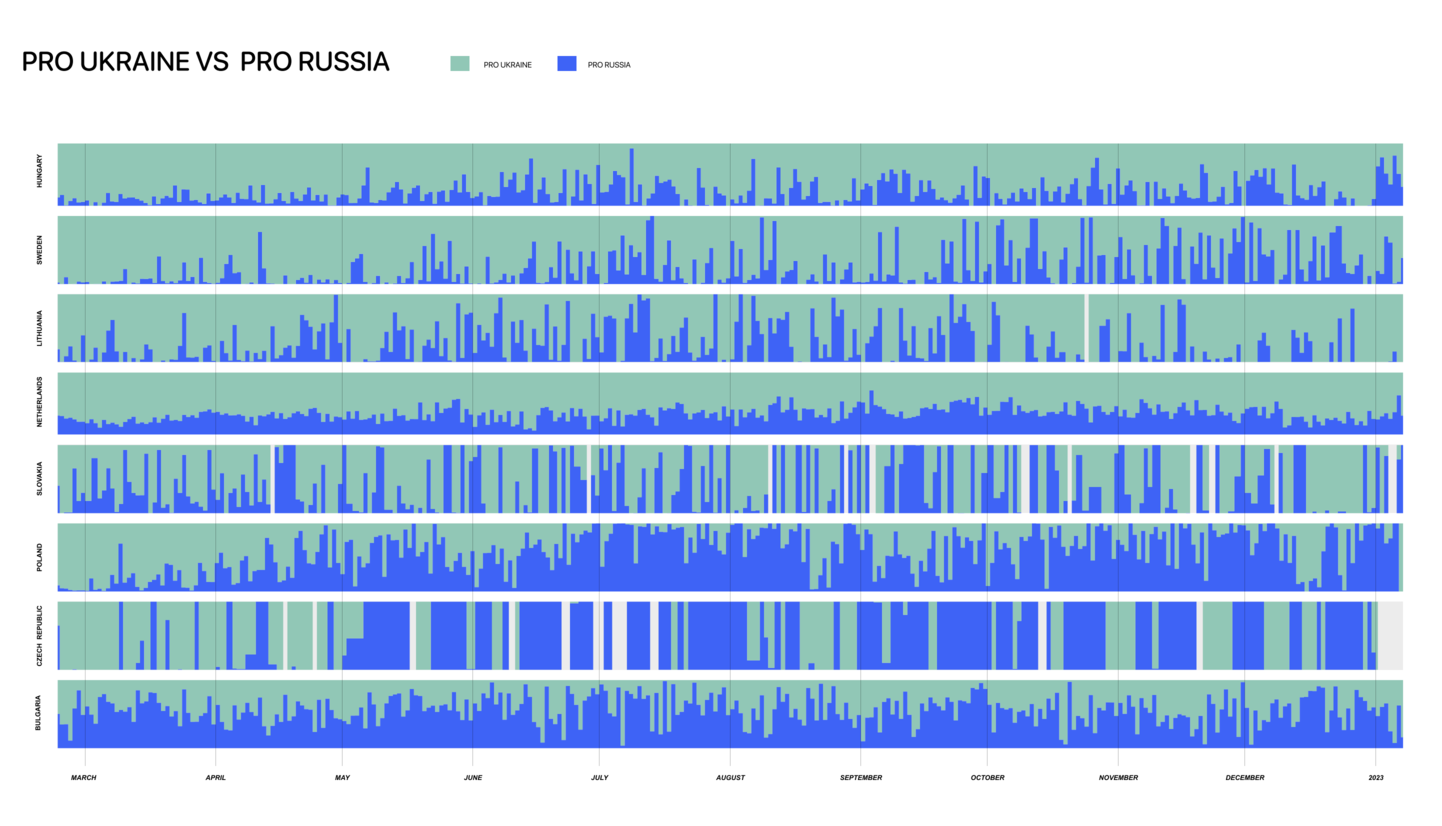
6. Discusion
7. Conclusions
8. References
Edit | Attach | Print version | History: r3 < r2 < r1 | Backlinks | View wiki text | Edit wiki text | More topic actions
Topic revision: r2 - 13 Feb 2023, KamilaKoronska
 Copyright © by the contributing authors. All material on this collaboration platform is the property of the contributing authors.
 Ideas, requests, problems regarding Foswiki? Send feedback
