You are here: Foswiki>Dmi Web>City_Speaks>DmiSummer2014Projects>EventImpact (30 Sep 2014, vimviriyaL)Edit Attach
Team Members: Emile den Tex, Eleonora Grotto, Patty Jansen, Philip Schuette (presenter), Simeona Petkova, Vimviriya Limkangvanmongkol (presenter), Anja Bechmann, Peter Vahlstrup (presentationns14.pdf)
Introduction
This project follows and attempts to localize an event through Instagram (IG) data by following an official hashtag (#ns14). Considered Denmark's second biggest music festival, NorthSide Festival is a commercial festival, held every year in June. The first festival was held in 2010 and it has evolved from a one-day event to a three-day festival in three years. In 2014, 35,000 participants in the festival to enjoy international and national talents.Research Questions
1. How can we study event impact (offline event) on IG through following an official #? 2. To what extent can we map visitors' preferences by looking at the frequencies of the IG images (posted, liked, commented, tagged)? 3. To what extent can we localize the festival through the geo tags in the IG media objects? 4. To what extent can we use IG data to qualify the festival?Theoretical Framework
The field of festival analysis is quite new and still under development. In 2012, the Crossmedia Lab published a white paper "Festival Experience: the Value of Public Events" in which they aim to specify core characteristics for constituting festivals' DNA and influencing the motivation of the visitors. Van Vliet and eds distinguish seven characteristics for festivals: 1. program (what visitors see and do at festivals); 2. information and marketing (activities to promote and provide further info on the festival also during the event); 3. food and drinks (the variety and the quality of the food and drinks at the festival); 4. comfort amenities (comfortable and safe festival environment with smart programming); 5. transport (accessibility of the festival as in terrain and parking spaces and as in for people with disabilities); 6. price (festival tickets, food and drinks and merchandise); 7. location (the spot where the festival is situated).Methodology
Step 1: We have worked with the IG dataset provided by the Digital Footprints Research Group at Aarhus University. Collected through using IG API, the dataset contains approximately 120,000 images and videos with the #ns14 and other #s from approximately 200,000 IG unique users. Step 2: We have qualitatively explored the data set and came across images and videos tagged with generic #s (#festivals) and decided to extract the images and videos for the official #ns14 within the time span of the festival (before, during, and after the event or 11th to 16th June 2014). By doing this, we had a sample of approximately 12,000 images and videos (total amount: appr. 780) from approximately 4,500 unique users. Step 3: We extracted the frequencies of occurrence in our sample (number of posts, likes, comments and tags) of the (unique) media objects, visualized their prominence and overlayed it on the timeline of the event (before, during and after) and on the actual festival program (from Red, Green and Blue stages). We took a random sample of 50 images per 6 hours and coded them manually whether their content was related to: 1. stage(concerts); 2. portraits (visitors); 3. selfie (visitors); 4. sphere (festival); and 5. not related to the event. We also coded the content of the top 200 most/least liked images and videos in our sample following the method above with additional code for videos since we found some in the dataset. Step 4: While exploring our sample data, we found out that many of the image objects had location_id and decided to explore this further. The location_id, however, was not corresponding to any geo coordinates and this is why we queried the IG API again for the top 200 most and least liked images and videos (through their media_id) to fetch their geo coordinates. The IG's API did return the exact geo parameters (as in latitude and longitude) per specific media_id (images or videos). Therefore, we used BatchGeo to convert the IG API coordinates into Google Maps readable ones.Findings
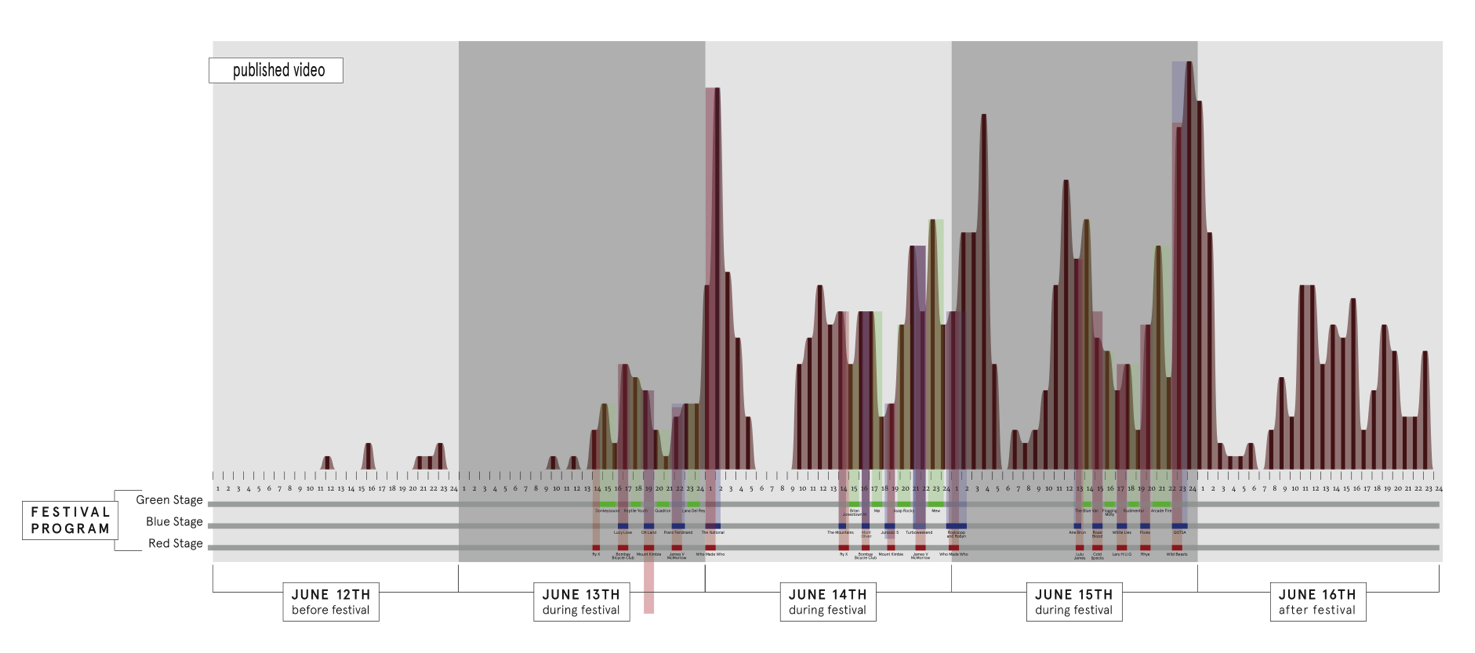
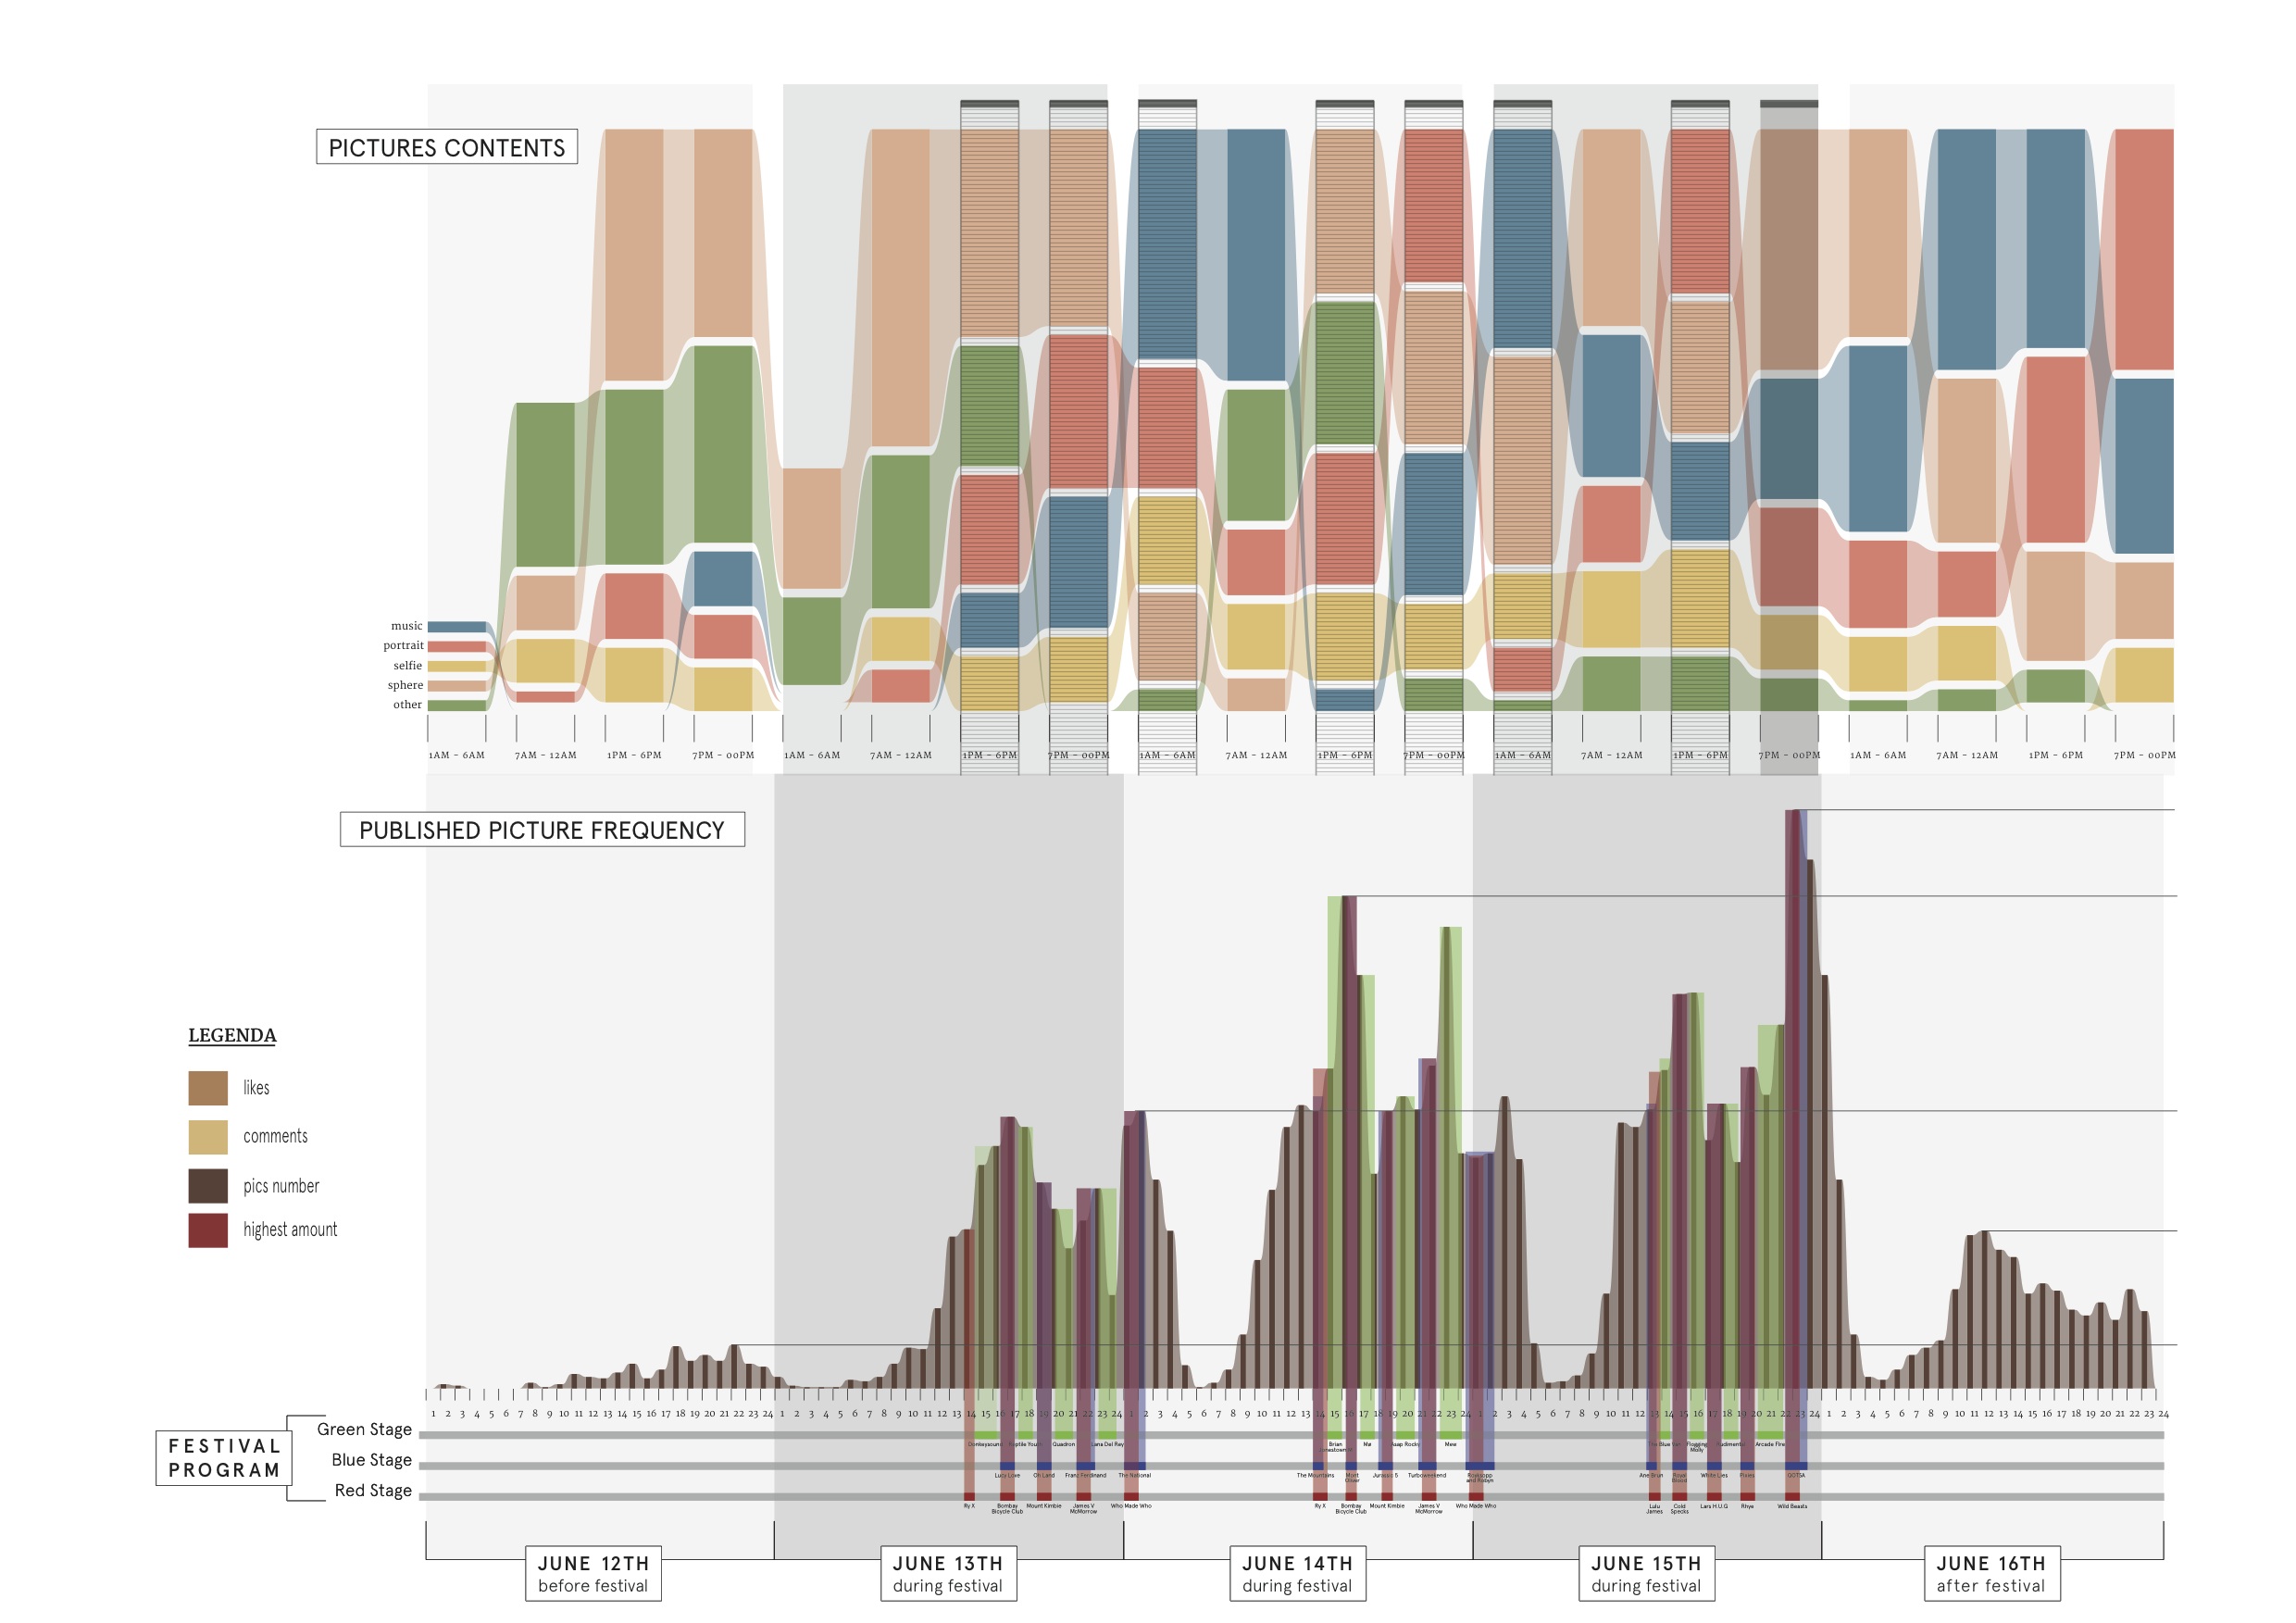
- Attendees started to post their images since the day before the festival. The number of images became second most highest in the afternoon of the second day of the festival (14th). The most peaking time of image posting was on the final day of the festival (15th) at the closure of the festival by the Queen of the Stone Age band at the Blue Stage and the Wild Beats at the Red Stage.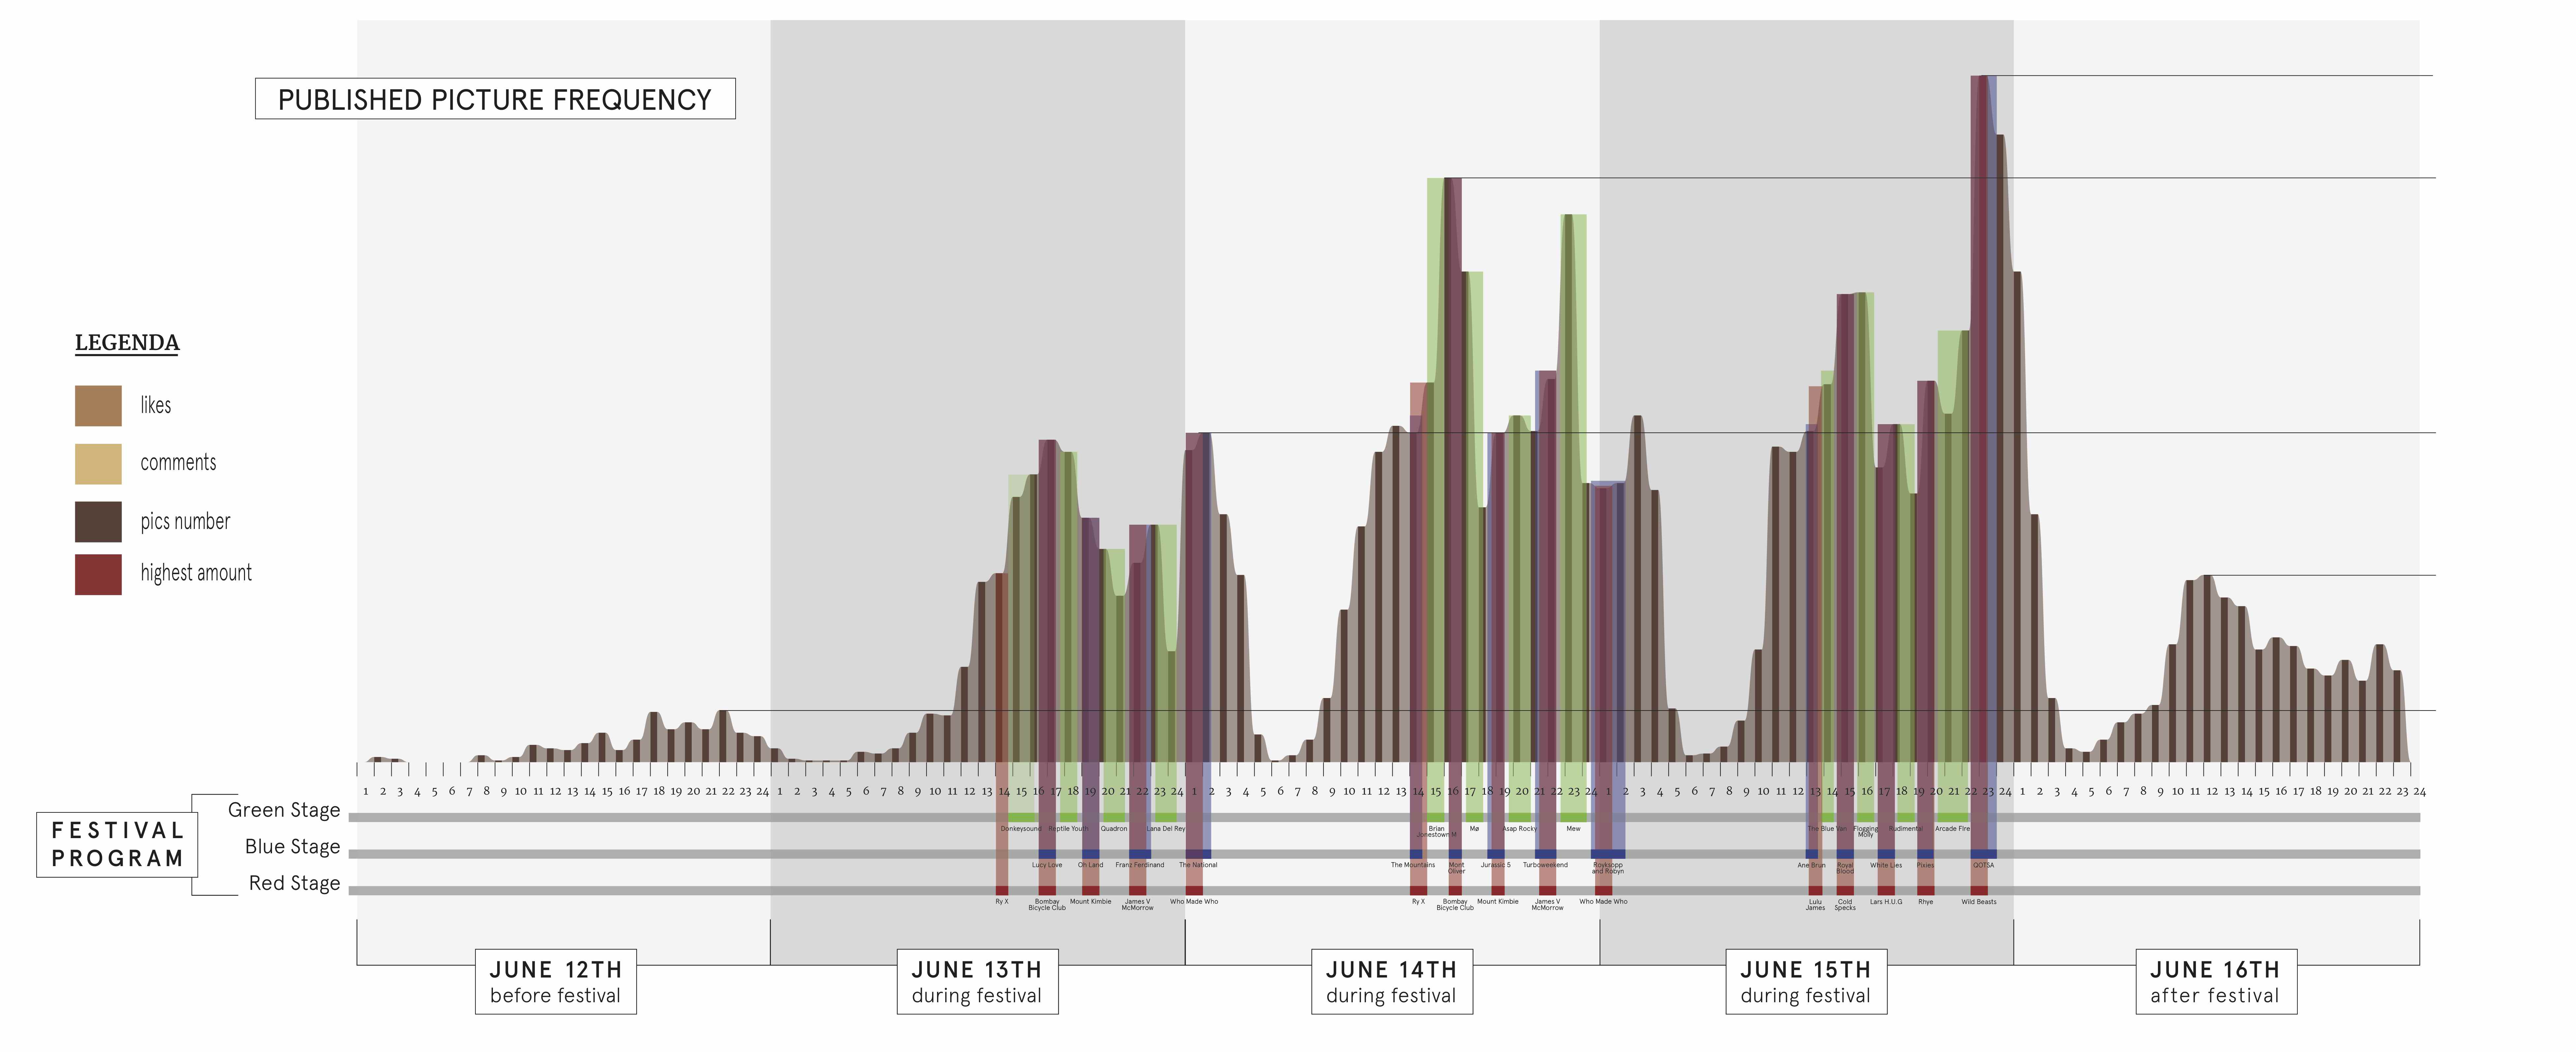 - A relatively small number of attendees started to post their videos since the day before the festival. Yet, higher numbers of videos posted were found right after the end of the first day of the festival (13th). Similar to the pattern of image posting period, video posting was at its peak on the final day of the festival (15th).
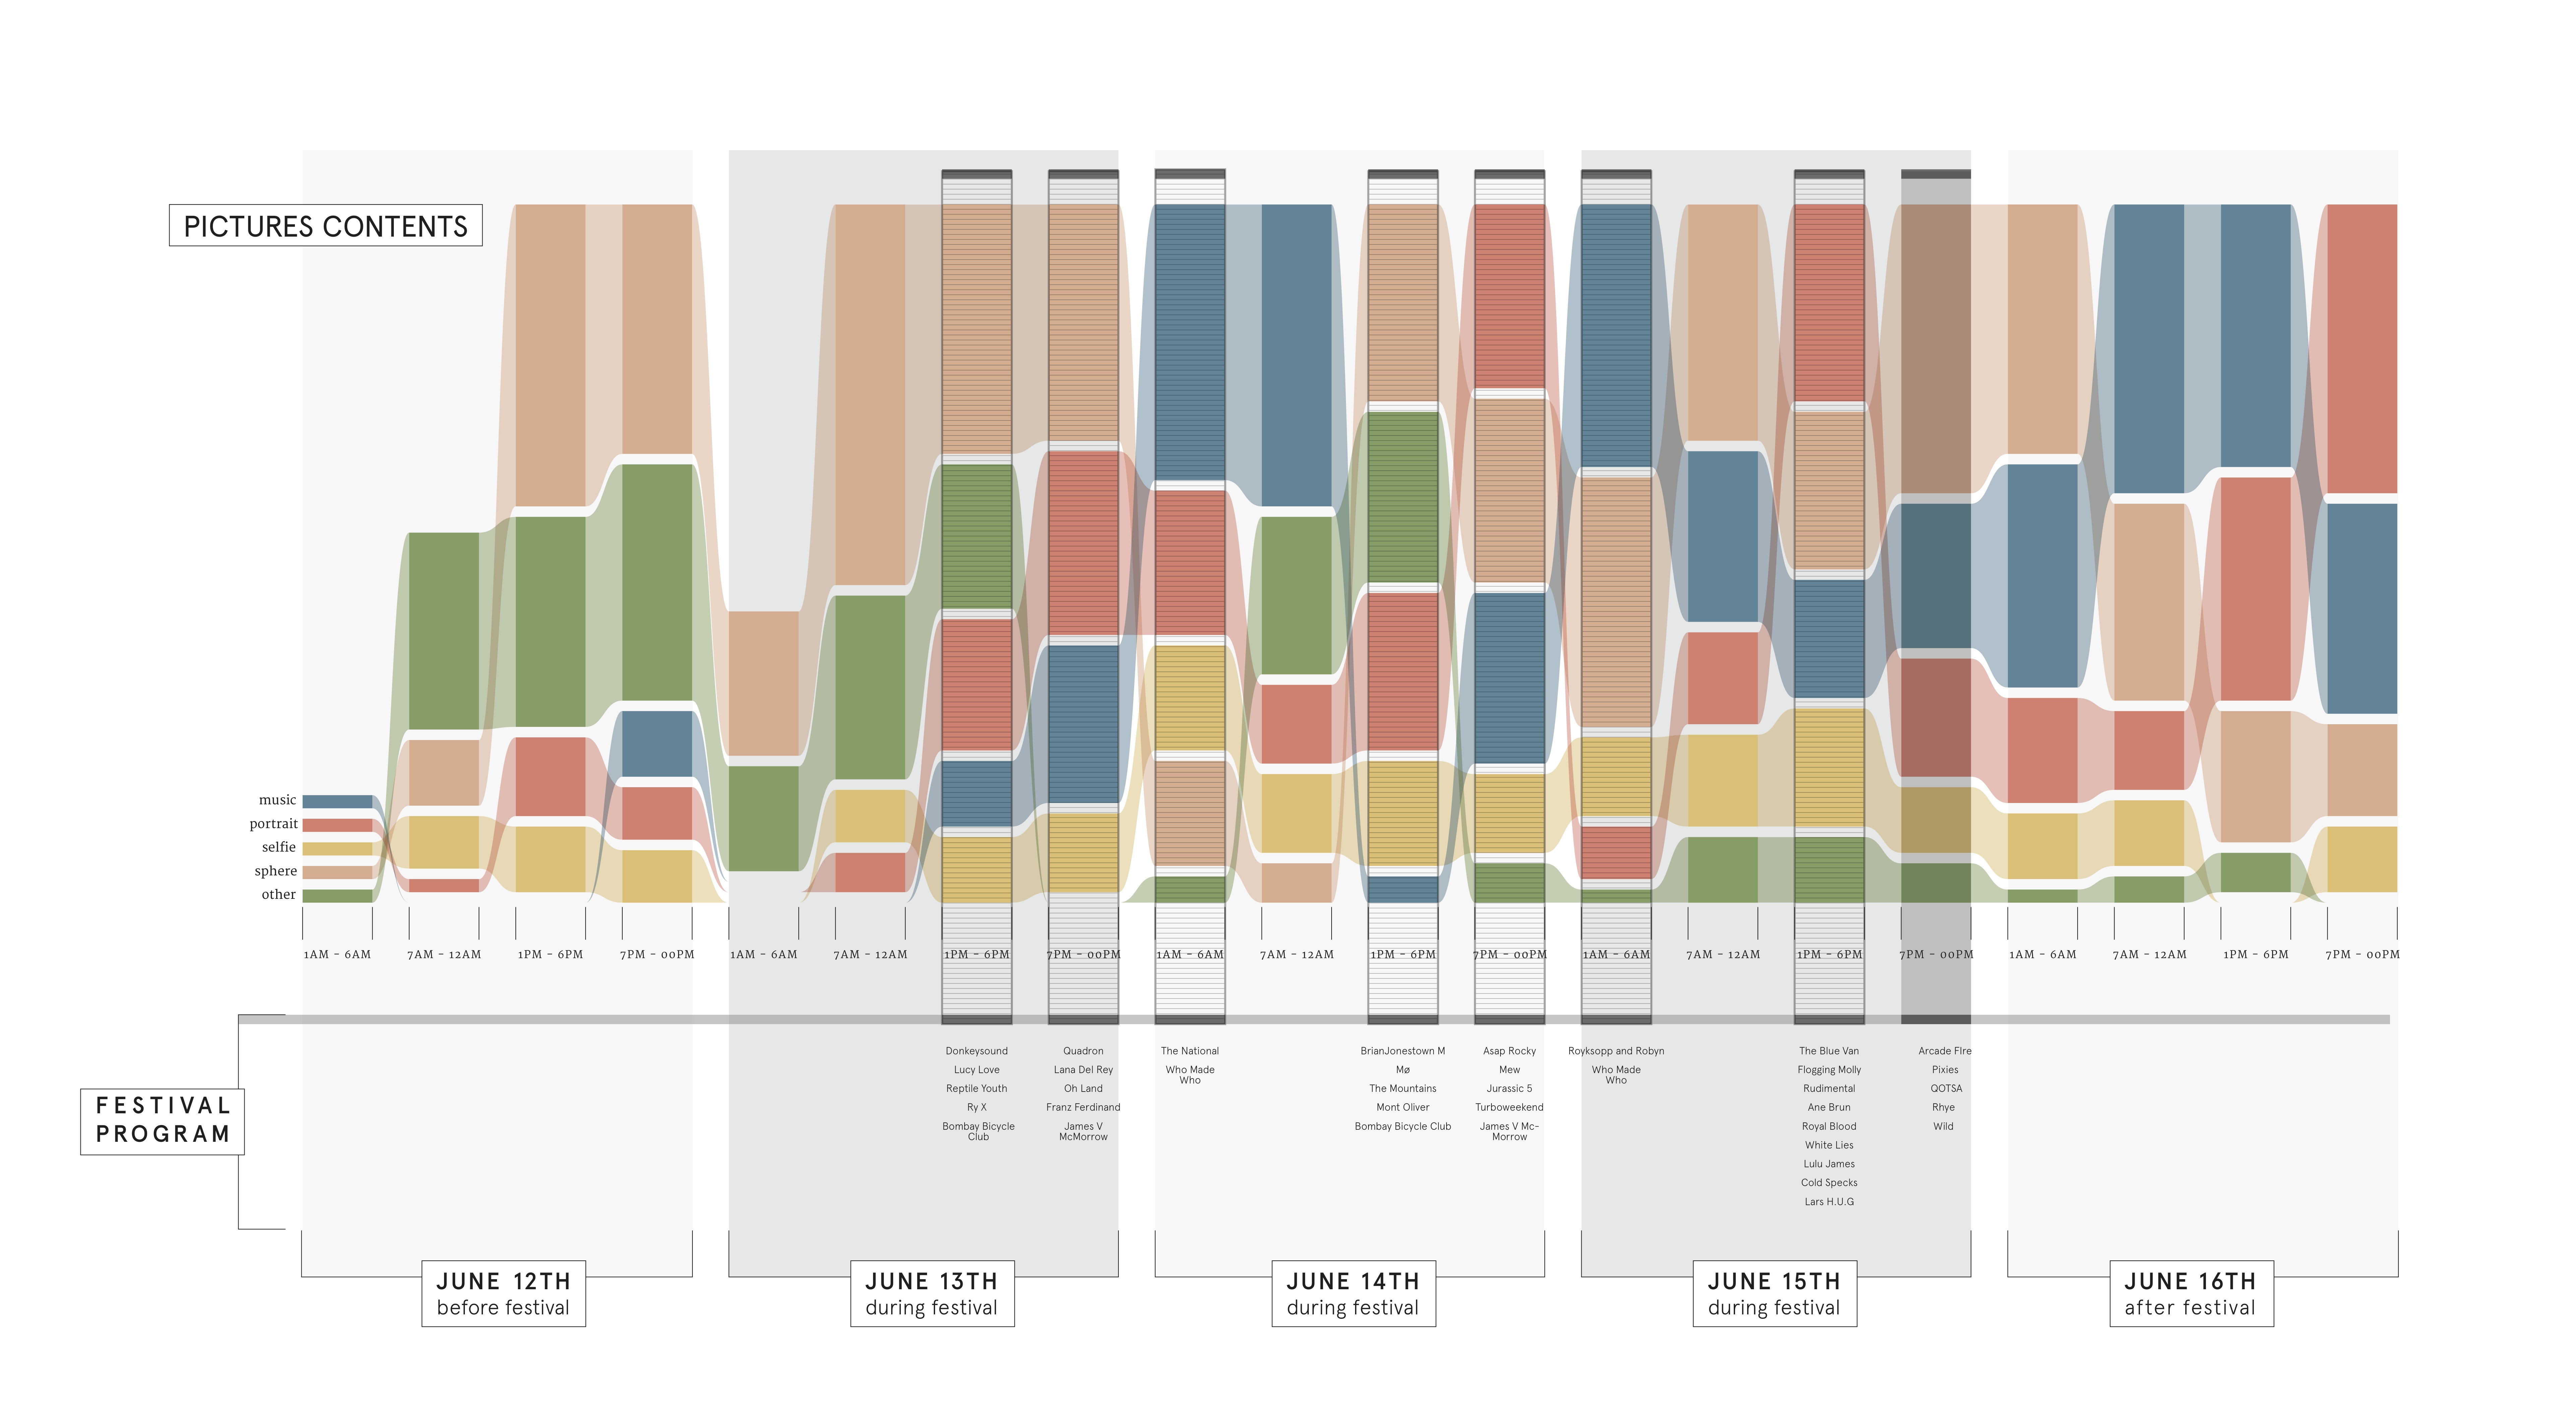
 - Among five coded categories of random sample images (music, portrait, selfie, sphere and non-related), the numbers of images related to the festival sphere were found highest before and during the festival. Attendees started to post images related to stage and music in a relatively small number before the festival. However, the numbers of images related to the festival sphere became at their peaks on the second day of the festival (14th) since the early morning til 12 midday and the third day of the festival (15th) at 01:00 to 06:00. Interestingly, the number of images related to the festival sphere reached the peaking point again on the post-festival day (16th). Moreover, we have found relatively high numbers of portrait content during the last two days of the festival (14th - 15th). Lastly, a relatively small number of images with selfie content were found before, during and after the event. Such patterns can be also further explored in the later works related to the festival.
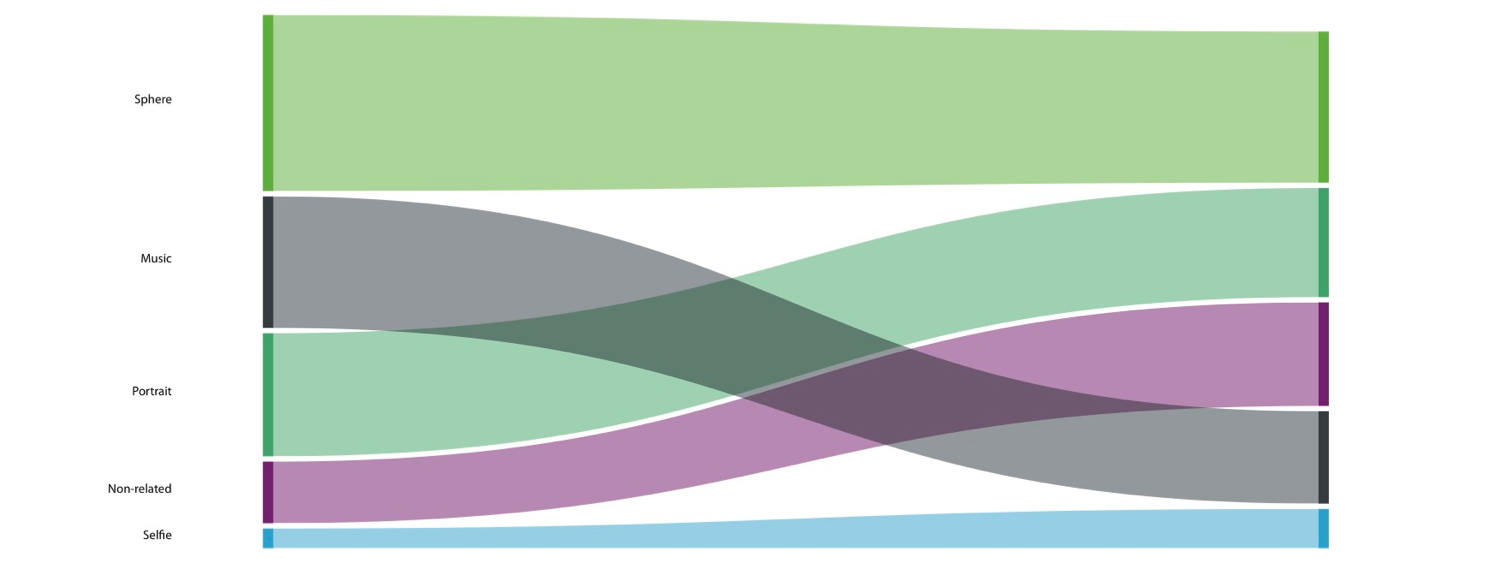
 - In the category of top 200 most and least liked images and videos, images related to the festival sphere are the most popular ones. Attendees in the former category also gave importance on the content related to music, portrait, non-related and selfie respectively. In contrast, those in the latter category also posted images with the content related to portrait, non-related, music and selfie respectively.
 Preliminary Conclusions
1. How can we study event impact on IG through following an official #?
- The methodologies employed (See Methodology Section) seem to deliver valid. Coding content of the dataset with #ns14 according to the selected timespan and finding for the geo-tag yielded both internal and external validity. As we can locate which types of contents were posted during which programs or times and from which stages, the methodologies yielded reliable and valid results. 2. To what extent can we map visitors' preferences by looking at the frequencies of the IG images (posted, liked, commented, tagged)? - The combination of frequencies and quality of the content enables us to look at the dataset in the level that both quantity and quality of the data can analyze the attendee's preferences. For example, the most peaking time of image and video posting was on the final day of the festival (15th). At this point, the highest numbers of posted images and videos can indicate the attendee's preferences of Queen of the Stone Age band at the Blue Stage and Wild Beats at the Red Stage performing at the closure of this year festival. Moreover, it is interesting to also look at how much attendees like the sphere of the festival evidenced by the highest numbers of images related to the festival sphere posted before and during the festival. Each image also describe attendees' particular preferences towards drinks, foods, or even the festival ambience. 3. To what extent can we localize the festival through the geo tags in the IG media objects? - Using the top 200 most and least liked images and videos (400 in total), we started applying the location data onto a maps (batchgeo.com). The result turned out about a little less than 50% of the IGs can be localized. Of these 180 IGs, approximately half seems to be tagged by means of choosing a location (see the prevention for different map level examples). The rest seems to deliver very accurate (11 number longtitude and latitude indications) geo locations. This becomes evident when zooming in and juxtaposing the festival map onto the map application. The data is very finely traceable. In this case, the top 200 most and least liked images and videos, however, do not deliver very interesting insights as they seem to be relatively evenly distributed across the festival ground. More interesting could have been to e.g. content cross reference the locations (band names, or image content).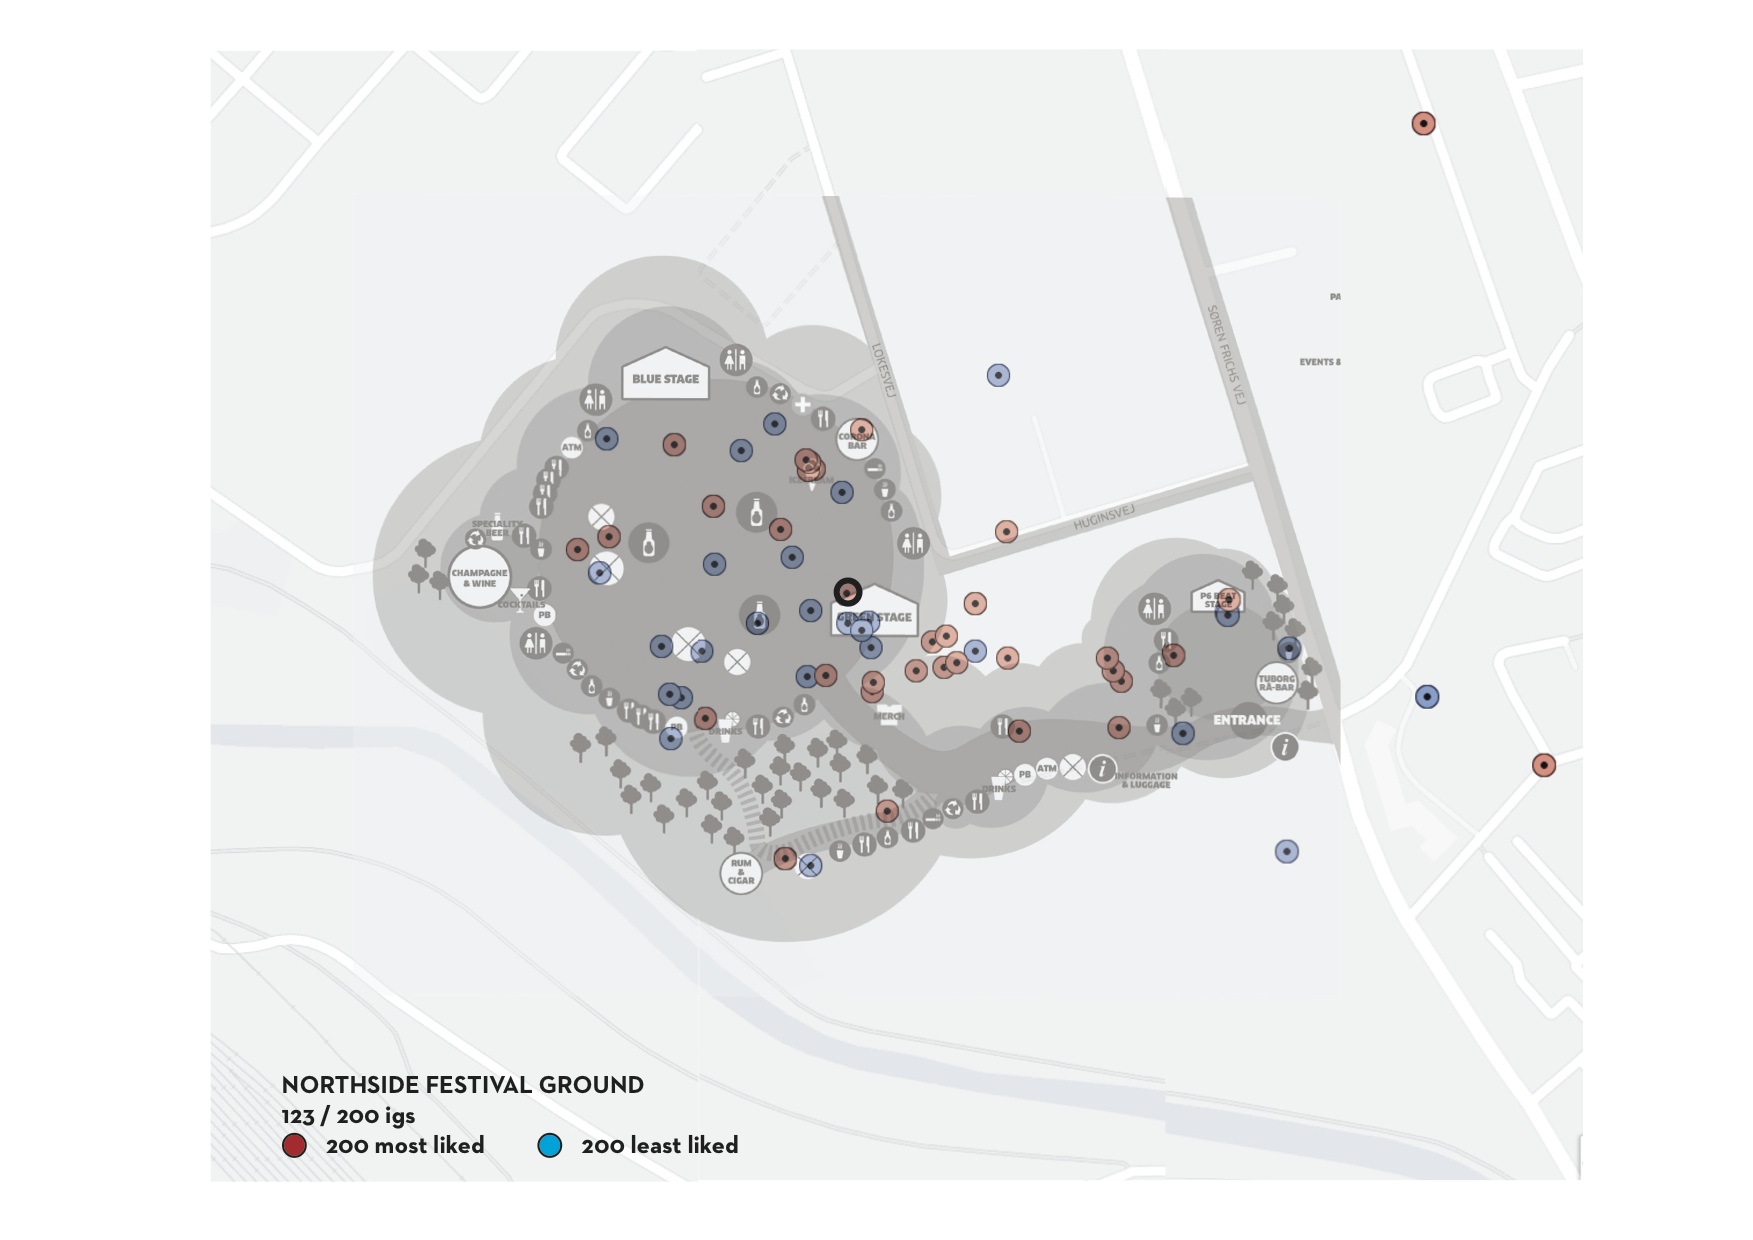 4. To what extent can we use IG data to qualify the festival?
- The qualtiy of the festival is shown through the findings from images and videos, especially in terms of the program selected aligning with the timespan of before, during and after the festival (12th - 16th of June). IG data primarily indicate frequencies of image and video posting, the content of the top 200 most and least liked images and videos as well as the attendee's preferences of bands. Mapping such data by the timespan and geo-tag can yield valid and reliable data that imply the quality of the festival in each time span and refer to the terrain of the event venue.
 Consequently, IG data can indicate the offline event impact qualitatively and quantitatively. Interestingly, such data can yield the implication of how the culture of visiting festival has been changed in the digital age. Therefore, measuring the impact of offline events by using IG data serve as an innovative and potential means to qualify the event.
 | I | Attachment | Action | Size | Date | Who | Comment |
|---|---|---|---|---|---|---|
| |
Presentationns14.pdf | manage | 3 MB | 30 Jul 2014 - 14:55 | Main.vimviriyaL |
Edit | Attach | Print version | History: r17 < r16 < r15 < r14 | Backlinks | View wiki text | Edit wiki text | More topic actions
Topic revision: r17 - 30 Sep 2014, vimviriyaL
 Copyright © by the contributing authors. All material on this collaboration platform is the property of the contributing authors.
 Ideas, requests, problems regarding Foswiki? Send feedback


