You are here: Foswiki>Dmi Web>Winter2011>CableTimeline (11 Mar 2011, EstherWeltevrede)Edit Attach
Cable Timeline
Team members: Carolin, Dominik, Esther, SimeonaProject description
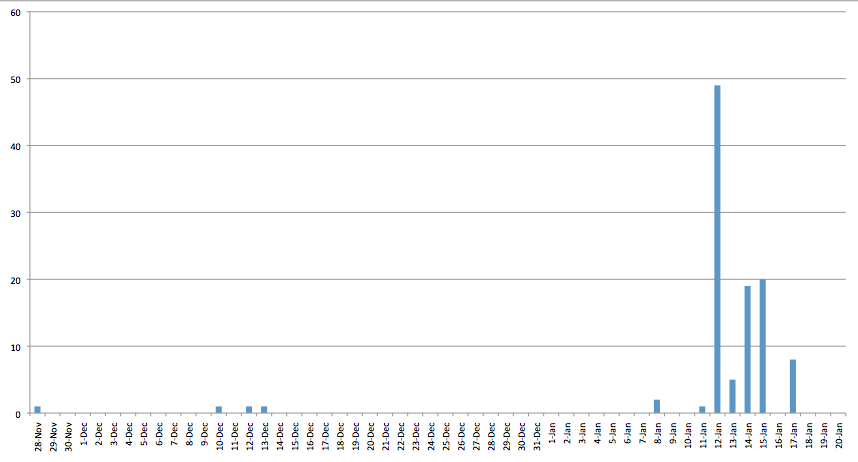
This aim of this study is to map the pace of Wikileaks Cables. We aim to do this in a 2 ways. The first is to visualize the pace of the creation date of cables versus the leak date of cables. See the example below, that shows the cables from The Hague. Pace of leaks (The Hague)
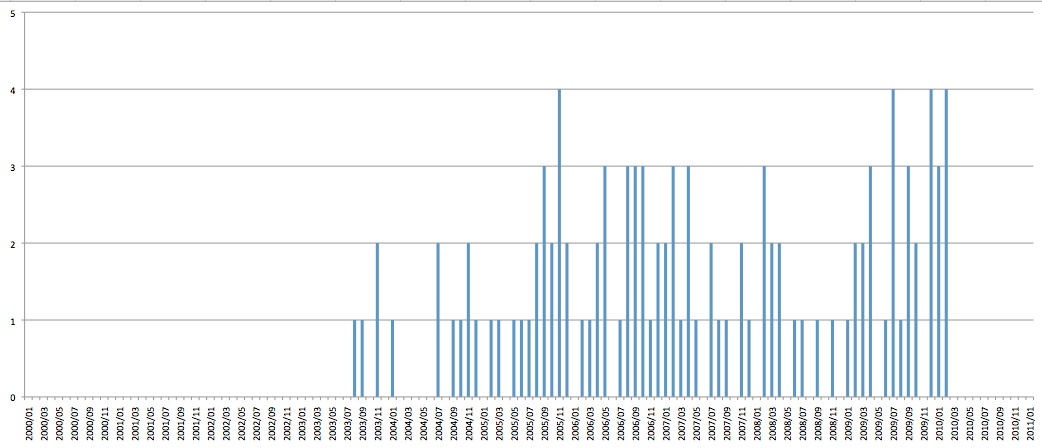
 Peaks of creation (The Hague)
In the second step, we aim to visualize the issues of of the cables over time. As inspiration for the visualization we have: Dynamic Word Cloud. When moving through time, the tags as used in the cables light up and when stopping at a certain date the tags resolve in their meaning.
Sources
http://www.cbc.ca/world/story/2010/11/29/f-database-wikileaks-cables.html?appSession=311975022201037&RecordID=&PageID=2&PrevPageID=1&cpipage=11&CPISortType=&CPIorderBy= https://spreadsheets.google.com/pub?key=0Auo8KSVAc9r8dHdnMGhjOXhhNzY0LTE0M0NqNmNTRHc&hl=en&output=html test| I | Attachment | Action | Size | Date | Who | Comment |
|---|---|---|---|---|---|---|
| |
Screen_shot_2011-01-25_at_4.38.40_PM.png | manage | 26 K | 25 Jan 2011 - 15:42 | EstherWeltevrede | |
| |
Screen_shot_2011-01-25_at_4.39.02_PM.png | manage | 29 K | 25 Jan 2011 - 15:43 | EstherWeltevrede |
Edit | Attach | Print version | History: r3 < r2 < r1 | Backlinks | View wiki text | Edit wiki text | More topic actions
Topic revision: r3 - 11 Mar 2011, EstherWeltevrede
 Copyright © by the contributing authors. All material on this collaboration platform is the property of the contributing authors.
 Ideas, requests, problems regarding Foswiki? Send feedback


