You are here: Foswiki>Issuecrawler Web>GexfExport (16 Mar 2015, EstherWeltevrede)Edit Attach
Experimental feature: GEXF export
GEXF (Graph Exchange XML Format) is a language for describing complex networks structures, their associated data and dynamics. It was developed for the Gephi graph vizualisation software but aims to be widely applicable as an interchange format for graph data. The issuecrawler output data in a private graph language, which is not compatible with other software. From the issuecrawler network overview page, it is also possible to export the issuecrawler graph data as a GEXF file that can be used in third-party software such as Gephi. In this wiki-topic the reader will find a short introduction to the file format, as well as suggestions of how to use the Gephi graph visualization software to explore issuecrawler networks. By no means is this an exhaustive specification of either the format nor the software or possible uses of this feature. Users should be aware that the feature is experimental. The system administration kindly requests users who run into issues or have requests regarding the output to contact them at webmaster@issuecrawlerREMOVE_ME.net.Generic Gephi tutorials
The Gephi site itself has these more general entry-level tutorials on using the software:The GEXF format
For a more detailled specification of the GEXF file format please refer to the XML schema on gexf.net, or for a more readable introduction to the primer. GEXF is basically a dialect of XML. Where XML is a generic markup language that describes the general structure of a data description language, GEXF is a specific implementation that defines syntactic elements for describing graphs. The two main elements in a GEXF file are nodes and edges. Two nodes can be linked together by an edge. For our purposes edges are directional, meaning that they always go from one node to another (reflexive edges, from a node to itself, are not used in the issuecrawler networks). Both edges and nodes can have attributes, which are denoted by annotations on the defining XML attributes. Nodes can also be grouped in a hierarchical structure through the parent-sibling relation.The issuecrawler GEXF files
The exported GEXF file defines two types of nodes: pages and sites. Pages are grouped together in their corresponding sites by the hierarchical parent-sibbling relation (the page-nodes being the children of the site-node). In addition, the following attributes are defined on site-nodes:- category - the 'category' of a site, a mapping from the top-level domain or second-level domain to generic categories such as 'commercial' and 'government';
- authority - number of inward links from the network
- knowledge - number of distinct sites this site links to
- in_network - whether this site is in the network (in a co-link analysis sense. See for the difference between core (in_network) and periphery FAQ#What_are_core_and_periphery_sites_63_Are_there_ever_isolates_63 and FAQ#Why_are_there_more_sites_in_the_UCINET_data_file_than_in_the_ranked_actor_list_or_the_svg_63 AND FAQ#What_is_the_actor_list_63
- inlinksfromcrawl - number of inward links from the crawled population
- tld - the top-level domain of the site domain
- sldtld - the top-level domain prepended with the second-level domain (if applicable, otherwise a copy of tld)
Gephi and the issuecrawler GEXF file
The latest version of the Gephi software can be found on the Gephi download page and is available for Linux, OSX and MS Windows. Installation instructions are linked to from the download page.Loading the issuecrawler GEXF file
To download a GEXF file from the issuecrawler, go to the Network Detail page by clicking on the title of a network int he archive. At the bottom of this page, among the small blue text links for advanced features, one finds the option 'Experimental export to: GEXF (Gephi)'. If this is the first time the GEXF file is requested for this network, it will be generated. This might take a while for larger networks. Once it is ready, it will be downloaded onto your computer. The file will be named ic_network_1234.gexf (where 1234 is replaced with the network id). Once downloaded start Gephi and open the downloaded GEXF file. Upon starting Gephi presents the opening screen, which offers a couple of choices on how to continue: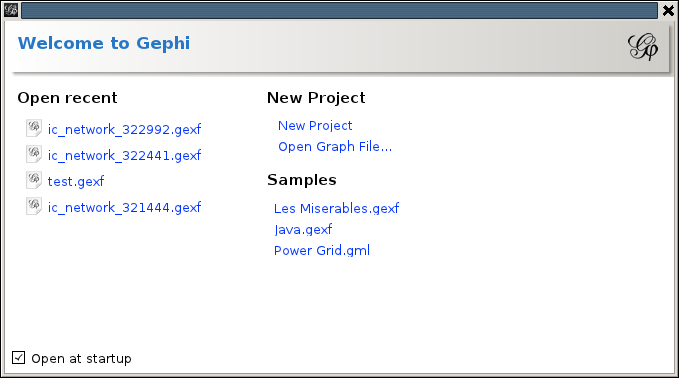 Under 'New Project' choose 'Open graph file...', and pick the downloaded file. When the file is loaded (on larger networks like snowball crawls, be prepared to wait a little) an 'Import report' will pop up:
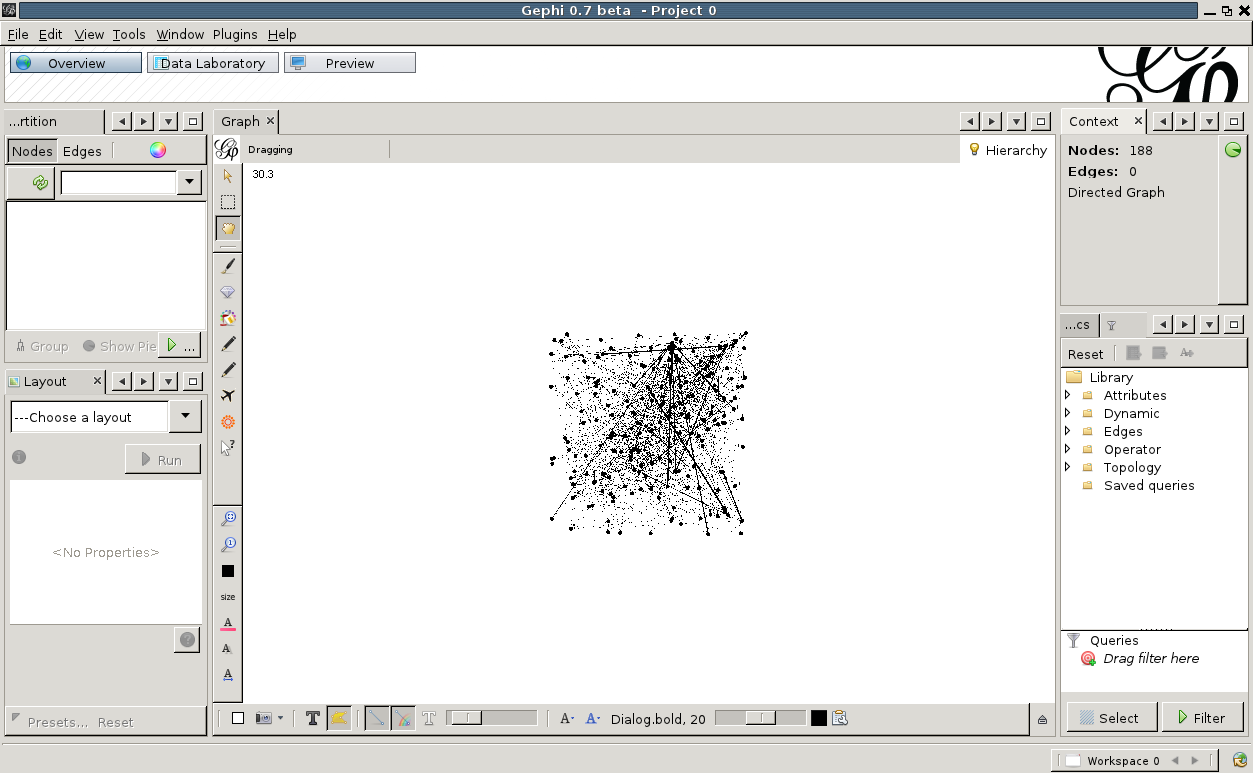
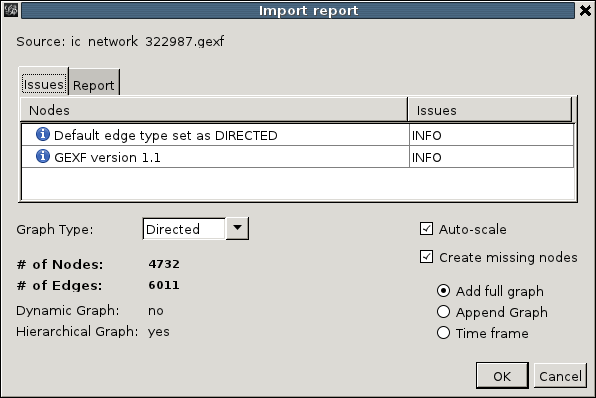 It allows us to adjust the auto-detected properties of the graph, but for issuecrawler files this is not necessary and we can click 'OK' right away. We now find ourselves in the Gephi overview mode:
Exploring the graph
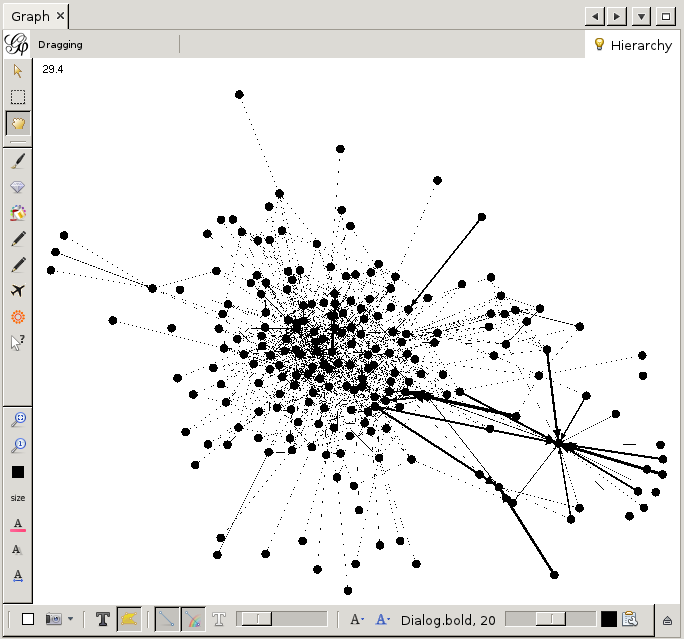
The main area of interest is the canvas in the middle. This is where the graph is visualized. Note that the edges between nodes vary in thickness, this represents the number of links between both nodes. More links means a thicker edge. Initially, the visualization is just a random arrangement of nodes and edges but we can customize that. To start with, let us improve the layout so we can discern some actual nodes. Have a look at the lower-left area of the screen, where it says 'Layout'. This allows us to apply placement algorithms to the generated map. In general, these operate by calculating repulsion and attraction between nodes based on certain metrics and attenuated or amplified by certain factors. Click on the dropdown '-- Choose layout' to choose from the standard layout algorithms.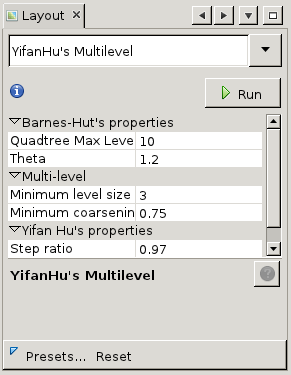 We have chosen for the 'Yifan Hu Proportional'. Now press 'Run' to apply the algorithm to the graph with default settings. You will see the nodes start moving. After a while, the algorithm shouldconverge and stop automatically. You can always stop the algorithm prematurely by clicking 'Stop'.
The graph may have moved outside of the viewport now, use the mouse to move and zoom. With your mouse in the graph window, click the right button and hold it while dragging the graph around. Use the scroll-wheel to zoom in and out. If at any point you loose your graph, you can find it back with the small magnifying glass icons at the left of the graph window. They are slightly below the middle of the toolbar. The first one, with a little dotted square in its visor, can be used to center the viewport on the entire graph. The second one, with a number 1 in the visor, centers on the middle of the graph.
We have chosen for the 'Yifan Hu Proportional'. Now press 'Run' to apply the algorithm to the graph with default settings. You will see the nodes start moving. After a while, the algorithm shouldconverge and stop automatically. You can always stop the algorithm prematurely by clicking 'Stop'.
The graph may have moved outside of the viewport now, use the mouse to move and zoom. With your mouse in the graph window, click the right button and hold it while dragging the graph around. Use the scroll-wheel to zoom in and out. If at any point you loose your graph, you can find it back with the small magnifying glass icons at the left of the graph window. They are slightly below the middle of the toolbar. The first one, with a little dotted square in its visor, can be used to center the viewport on the entire graph. The second one, with a number 1 in the visor, centers on the middle of the graph.
 This is already a lot better. But still, it is a bit bland. Let us add some color. To this end we need the 'partition' window on the top left.
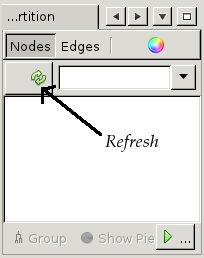 =>
=> 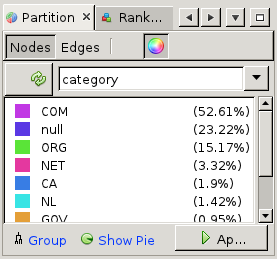 First, click on the 'refresh' button to load the list of properties that can be used for partitioning. Now from the drop-down list next to it, choose 'category' (to color based on top-level domain choose 'tld'). You will see a list of categories (which were added by the crawler) appear. Then click 'Apply' at the bottom of the partition window, and see the node colors change.
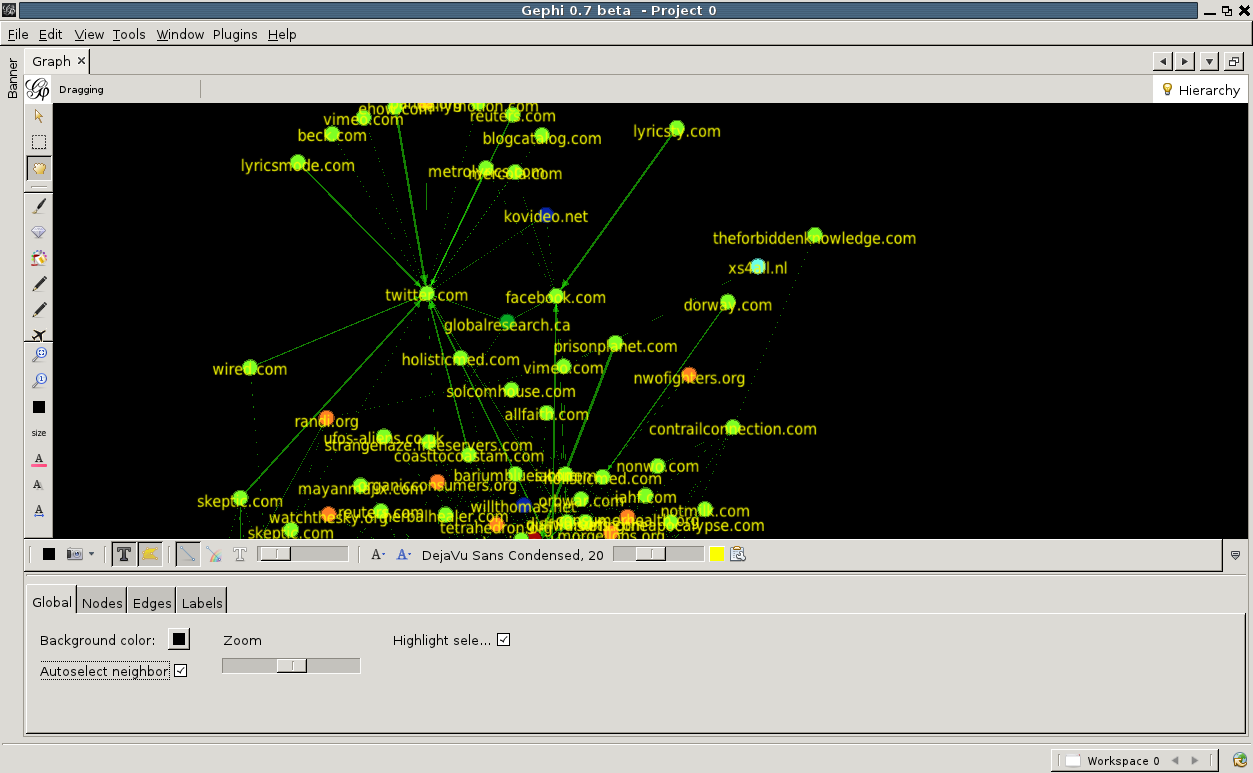
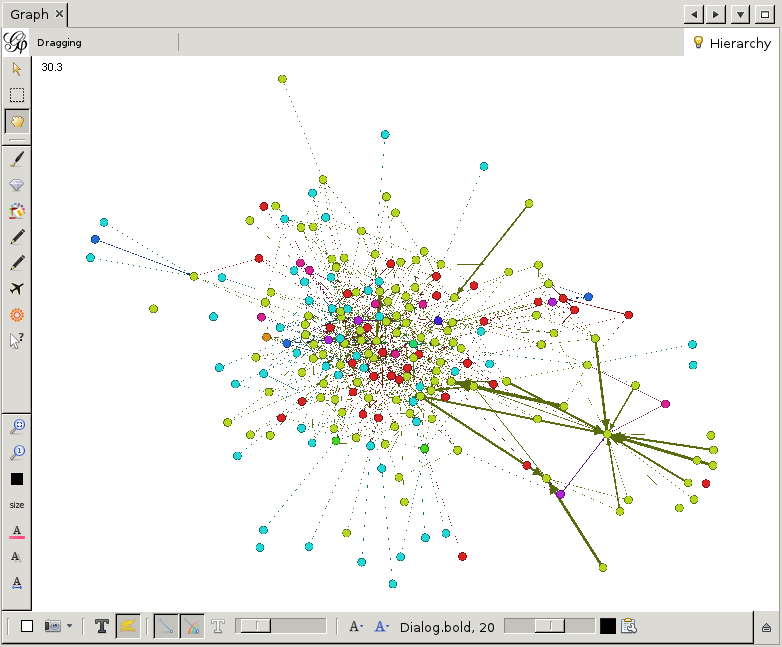 Finally, let us add labels to the nodes. Click on the big black T at the bottom of the graph window. You will see the labels appear, although they are a bit large. This, and other properties of the labels, can be adjusted by the various buttons to the right of the big black T. You can change the font, the scaling and more. By clicking on the little arrow pointing upwards located at the far right of this bottom toolbar, advanced settings can be accessed. Here one can change for example the background color, the edge scaling and other options.
Note the 'autoselect neighbour' checkbox. Check it, now move the mouse pointer over any node. The node will be highlighted, and the nodes that link to it or are linked by it.
Finally, let us add labels to the nodes. Click on the big black T at the bottom of the graph window. You will see the labels appear, although they are a bit large. This, and other properties of the labels, can be adjusted by the various buttons to the right of the big black T. You can change the font, the scaling and more. By clicking on the little arrow pointing upwards located at the far right of this bottom toolbar, advanced settings can be accessed. Here one can change for example the background color, the edge scaling and other options.
Note the 'autoselect neighbour' checkbox. Check it, now move the mouse pointer over any node. The node will be highlighted, and the nodes that link to it or are linked by it.
Export graph
Now that we are happy with the appearance of our graph, let us export this to svg or pdf. On the top, click on 'Preview'. You will be presented with an empty screen sided with a list of Preview Settings.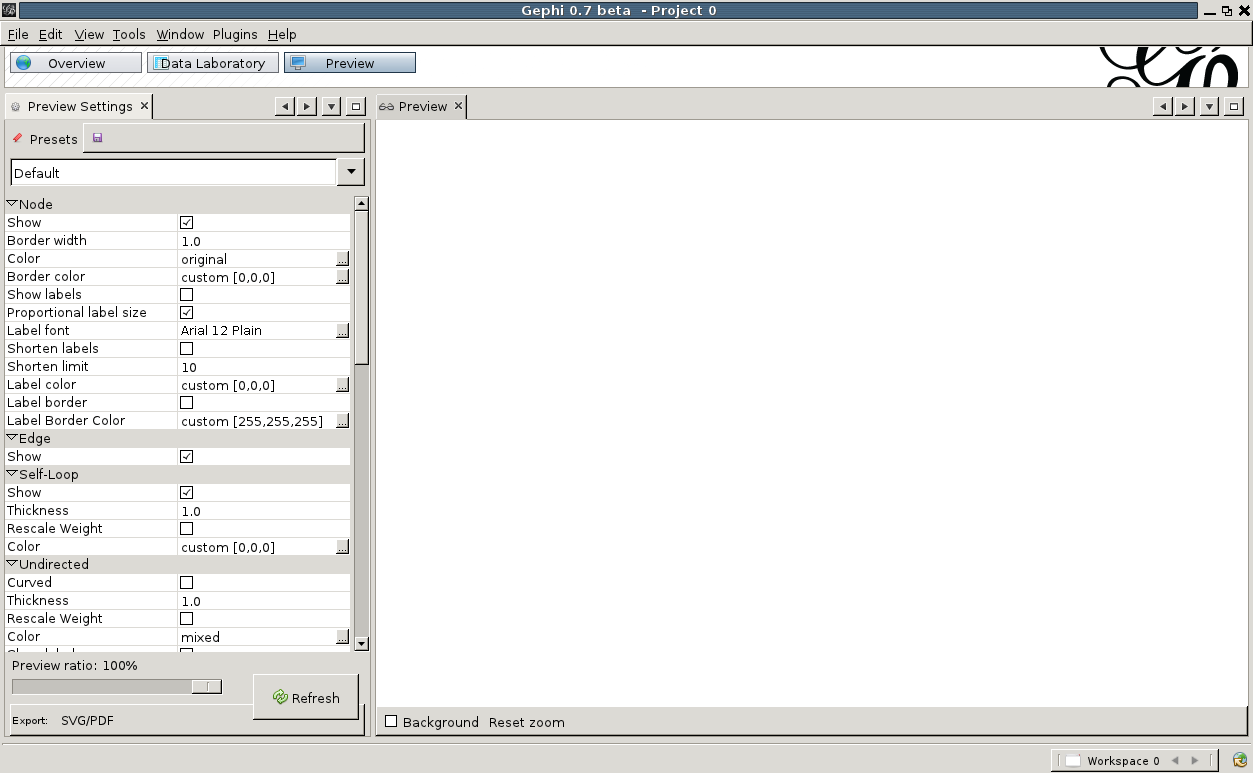 To show a preview of what will be exported, hit 'Refresh' at the bottom of the settings window. The default presets are not very pretty to begin with. Change 'Default' to 'Default Straight' in the drop-down at the top of the settings window, and hit 'Refresh' again. That is already better. Now we can play with the various settings, change the background to black for example, set the label and edge color, etc. Once done, hit 'Refresh' again and the preview will show what your export will look like.
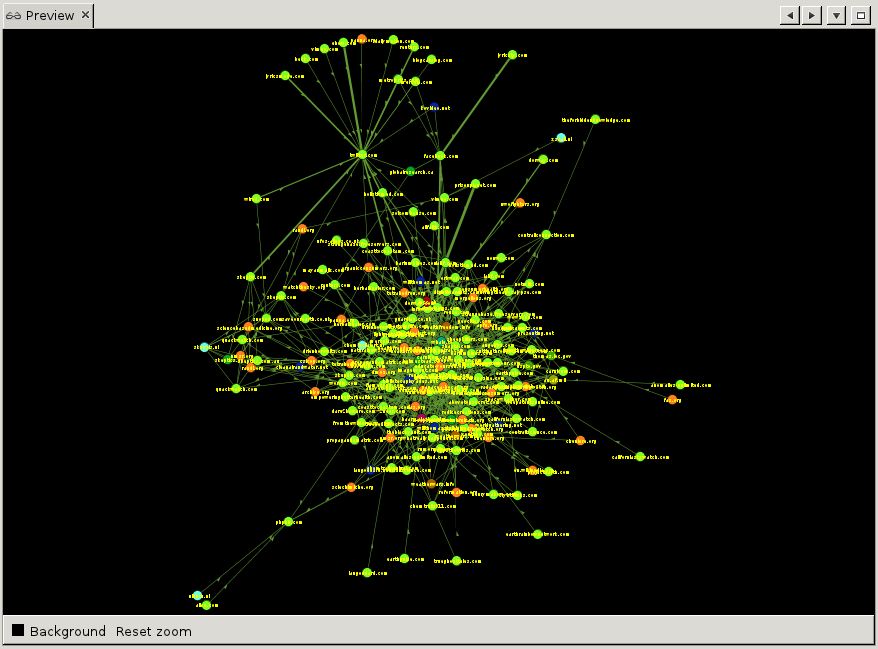 Finally, at the bottom of the settings window, hit 'Export SVG' or 'Export PDF' to save your visualisation. Note that you can save your custom presets by clicking the little floppy-disk icon at the top of the settings window next to 'Presets'.
Advanced usage
This tutorial has barely touched upon the available features. This paragraph hints at some of the more advanced features. First of all, the issuecrawler graph is hierarchical. So far we have only looked at sites. Sites consist of pages, and it is between pages that the interlinking is defined. Gephi is smart enough to extrapolate the page interlinkings to site interlinkings. By default, the weight of edges between sites is the sum of the weight of all edges between pages in those sites. To change this to average, use the 'Hierarchy' tab at the top-right of the graph window. In the same pop-up, one change from the site-level (level 0) to the page-level (level 1) and back again. The number of pages is usually quite high, so be prepared to have some patience when working on the page level. The partition window described earlier actually gives access to a whole range of functions to change the appearance of the graph. For example, under 'ranking' it is possible to change the color or the size of nodes, edges and labels based on various ranking parameters. For example, to sites according to the number of pages go to the ranking tab and select the diamond icon for size. Here select the 'children count' from the drop-down menu and adjust the sizes. After pressing Apply, the nodes will be scaled according to the chosen ranking parameter.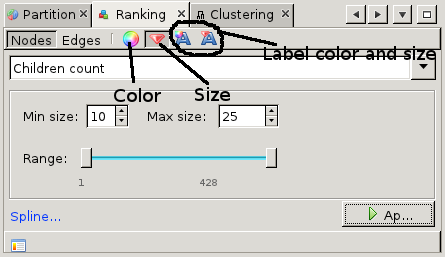 One of the main views we have not described is the Data Laboratory. This view gives access to the node properties, and allows us to add columns or change existing columns. From the Overview page, we can also apply statistics which result in new columns with certain network metrics.
And last but not least, among the layout algorithms is the 'Label Adjust' algorithm. This can be run after your regular layout algorithm, and will nudge the nodes slightly so that all labels are readable. This might not be possible in particular dense maps without increasing the distance between nodes in the original layout algorithm.
One of the main views we have not described is the Data Laboratory. This view gives access to the node properties, and allows us to add columns or change existing columns. From the Overview page, we can also apply statistics which result in new columns with certain network metrics.
And last but not least, among the layout algorithms is the 'Label Adjust' algorithm. This can be run after your regular layout algorithm, and will nudge the nodes slightly so that all labels are readable. This might not be possible in particular dense maps without increasing the distance between nodes in the original layout algorithm.
Differences with the cluster-map visualisation
- Specificity
- Node coloring
Planned development
We believe Gephi will become (and in fact already is) a very valuable tool in network analysis. It is better suited at visualizing large graphs, such as the issuecrawler output of a snowball or inter-actor crawl, than the original issuecrawler visualization module. The long-term vision is therefore to replace the existing module with a server-side Gephi visualization. We will take it step by step, and the experimental export function is just the beginning. Other planned features are:- duplicate the output of the current visualisation module (including the specificity measure) with Gephi;
- integrate Gephi as a server-side visualisation module;
- add tld and if applicable sld to node properties for partitioning, current 'category' maps .com. to COM for example;
- ...


| I | Attachment | Action | Size | Date | Who | Comment |
|---|---|---|---|---|---|---|
| |
gephi_0.png | manage | 23 K | 19 Apr 2011 - 08:27 | KoenMartens | Welcome screen |
| |
gephi_1.png | manage | 26 K | 19 Apr 2011 - 08:27 | KoenMartens | Import report |
| |
gephi_10.png | manage | 178 K | 19 Apr 2011 - 10:34 | KoenMartens | Export preview |
| |
gephi_11.png | manage | 19 K | 19 Apr 2011 - 10:35 | KoenMartens | Export preview with custom settings |
| |
gephi_2.png | manage | 84 K | 19 Apr 2011 - 08:28 | KoenMartens | Overview |
| |
gephi_3.png | manage | 18 K | 19 Apr 2011 - 08:28 | KoenMartens | Layout settings |
| |
gephi_4.png | manage | 39 K | 19 Apr 2011 - 08:29 | KoenMartens | Graph with layout |
| |
gephi_5.png | manage | 9 K | 19 Apr 2011 - 09:16 | KoenMartens | Partition and ranking window |
| |
gephi_6.png | manage | 16 K | 19 Apr 2011 - 09:16 | KoenMartens | Coloring nodes |
| |
gephi_7.png | manage | 50 K | 19 Apr 2011 - 09:17 | KoenMartens | Graph with colored nodes |
Edit | Attach | Print version | History: r8 < r7 < r6 < r5 | Backlinks | View wiki text | Edit wiki text | More topic actions
Topic revision: r8 - 16 Mar 2015, EstherWeltevrede
Ideas, requests, problems regarding Foswiki? Send feedback